Here's How We Evaluate WEC Energy Group, Inc.'s (NYSE:WEC) Dividend

Today we'll take a closer look at WEC Energy Group, Inc. (NYSE:WEC) from a dividend investor's perspective. Owning a strong business and reinvesting the dividends is widely seen as an attractive way of growing your wealth. If you are hoping to live on your dividends, it's important to be more stringent with your investments than the average punter. Regular readers know we like to apply the same approach to each dividend stock, and we hope you'll find our analysis useful.
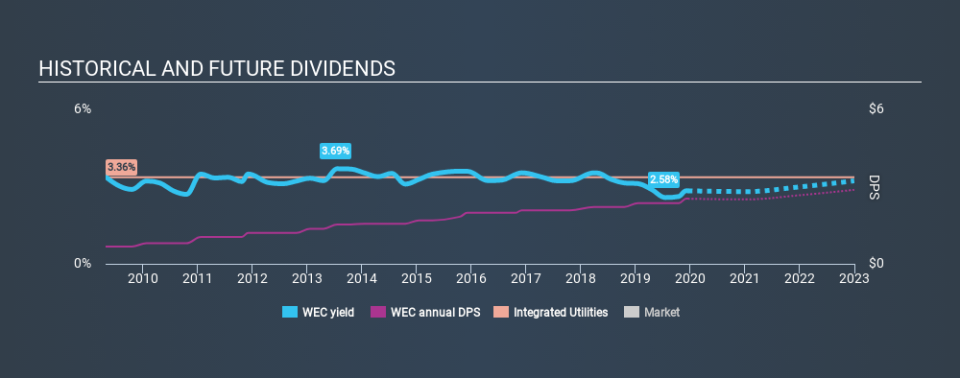
While WEC Energy Group's 2.8% dividend yield is not the highest, we think its lengthy payment history is quite interesting. Before you buy any stock for its dividend however, you should always remember Warren Buffett's two rules: 1) Don't lose money, and 2) Remember rule #1. We'll run through some checks below to help with this.
Click the interactive chart for our full dividend analysis
Payout ratios
Dividends are typically paid from company earnings. If a company pays more in dividends than it earned, then the dividend might become unsustainable - hardly an ideal situation. Comparing dividend payments to a company's net profit after tax is a simple way of reality-checking whether a dividend is sustainable. In the last year, WEC Energy Group paid out 67% of its profit as dividends. A payout ratio above 50% generally implies a business is reaching maturity, although it is still possible to reinvest in the business or increase the dividend over time.
Another important check we do is to see if the free cash flow generated is sufficient to pay the dividend. WEC Energy Group paid out 519% of its free cash flow last year, which we think is concerning if cash flows do not improve. Paying out such a high percentage of cash flow suggests that the dividend was funded from either cash at bank or by borrowing, neither of which is desirable over the long term. WEC Energy Group paid out less in dividends than it reported in profits, but unfortunately it didn't generate enough free cash flow to cover the dividend. Cash is king, as they say, and were WEC Energy Group to repeatedly pay dividends that aren't well covered by cashflow, we would consider this a warning sign.
Is WEC Energy Group's Balance Sheet Risky?
As WEC Energy Group has a meaningful amount of debt, we need to check its balance sheet to see if the company might have debt risks. A quick check of its financial situation can be done with two ratios: net debt divided by EBITDA (earnings before interest, tax, depreciation and amortisation), and net interest cover. Net debt to EBITDA measures total debt load relative to company earnings (lower = less debt), while net interest cover measures the ability to pay interest on the debt (higher = greater ability to pay interest costs). WEC Energy Group has net debt of 5.09 times its EBITDA, which implies meaningful risk if interest rates rise of earnings decline.
Net interest cover can be calculated by dividing earnings before interest and tax (EBIT) by the company's net interest expense. With EBIT of 3.02 times its interest expense, WEC Energy Group's interest cover is starting to look a bit thin. High debt and weak interest cover are not a great combo, and we would be cautious of relying on this company's dividend while these metrics persist.
Consider getting our latest analysis on WEC Energy Group's financial position here.
Dividend Volatility
From the perspective of an income investor who wants to earn dividends for many years, there is not much point buying a stock if its dividend is regularly cut or is not reliable. WEC Energy Group has been paying dividends for a long time, but for the purpose of this analysis, we only examine the past 10 years of payments. The dividend has been stable over the past 10 years, which is great. We think this could suggest some resilience to the business and its dividends. During the past ten-year period, the first annual payment was US$0.68 in 2009, compared to US$2.53 last year. This works out to be a compound annual growth rate (CAGR) of approximately 14% a year over that time.
Dividends have been growing pretty quickly, and even more impressively, they haven't experienced any notable falls during this period.
Dividend Growth Potential
While dividend payments have been relatively reliable, it would also be nice if earnings per share (EPS) were growing, as this is essential to maintaining the dividend's purchasing power over the long term. WEC Energy Group has grown its earnings per share at 6.5% per annum over the past five years. Earnings per share are growing at an acceptable rate, although the company is paying out more than half of its profits, which we think could constrain its ability to reinvest in its business.
Conclusion
When we look at a dividend stock, we need to form a judgement on whether the dividend will grow, if the company is able to maintain it in a wide range of economic circumstances, and if the dividend payout is sustainable. WEC Energy Group gets a pass on its dividend payout ratio, but it paid out virtually all of its cash flow as dividends. This may just be a one-off, but we'd keep an eye on this. Second, earnings growth has been mediocre, but at least the dividends have been relatively stable. Ultimately, WEC Energy Group comes up short on our dividend analysis. It's not that we think it is a bad company - just that there are likely more appealing dividend prospects out there on this analysis.
Companies that are growing earnings tend to be the best dividend stocks over the long term. See what the 10 analysts we track are forecasting for WEC Energy Group for free with public analyst estimates for the company.
Looking for more high-yielding dividend ideas? Try our curated list of dividend stocks with a yield above 3%.
If you spot an error that warrants correction, please contact the editor at editorial-team@simplywallst.com. This article by Simply Wall St is general in nature. It does not constitute a recommendation to buy or sell any stock, and does not take account of your objectives, or your financial situation. Simply Wall St has no position in the stocks mentioned.
We aim to bring you long-term focused research analysis driven by fundamental data. Note that our analysis may not factor in the latest price-sensitive company announcements or qualitative material. Thank you for reading.
