Here's What Fiat Chrysler Automobiles N.V.'s (BIT:FCA) P/E Ratio Is Telling Us

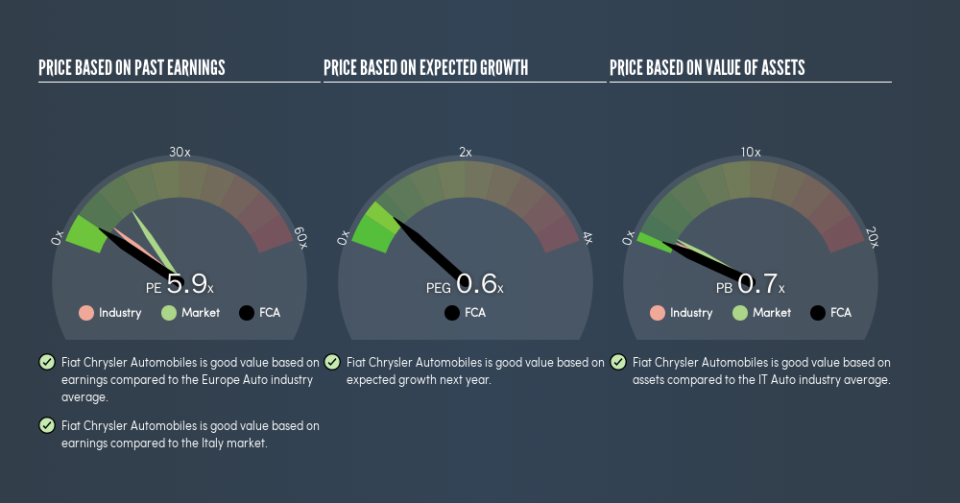
The goal of this article is to teach you how to use price to earnings ratios (P/E ratios). We'll show how you can use Fiat Chrysler Automobiles N.V.'s (BIT:FCA) P/E ratio to inform your assessment of the investment opportunity. Fiat Chrysler Automobiles has a P/E ratio of 5.9, based on the last twelve months. That corresponds to an earnings yield of approximately 17%.
View our latest analysis for Fiat Chrysler Automobiles
How Do You Calculate Fiat Chrysler Automobiles's P/E Ratio?
The formula for P/E is:
Price to Earnings Ratio = Price per Share ÷ Earnings per Share (EPS)
Or for Fiat Chrysler Automobiles:
P/E of 5.9 = €11.26 ÷ €1.91 (Based on the year to June 2019.)
Is A High Price-to-Earnings Ratio Good?
The higher the P/E ratio, the higher the price tag of a business, relative to its trailing earnings. That isn't necessarily good or bad, but a high P/E implies relatively high expectations of what a company can achieve in the future.
How Does Fiat Chrysler Automobiles's P/E Ratio Compare To Its Peers?
The P/E ratio indicates whether the market has higher or lower expectations of a company. If you look at the image below, you can see Fiat Chrysler Automobiles has a lower P/E than the average (8.6) in the auto industry classification.
Fiat Chrysler Automobiles's P/E tells us that market participants think it will not fare as well as its peers in the same industry. Many investors like to buy stocks when the market is pessimistic about their prospects. You should delve deeper. I like to check if company insiders have been buying or selling.
How Growth Rates Impact P/E Ratios
Generally speaking the rate of earnings growth has a profound impact on a company's P/E multiple. If earnings are growing quickly, then the 'E' in the equation will increase faster than it would otherwise. That means even if the current P/E is high, it will reduce over time if the share price stays flat. And as that P/E ratio drops, the company will look cheap, unless its share price increases.
Fiat Chrysler Automobiles shrunk earnings per share by 7.8% last year. But it has grown its earnings per share by 23% per year over the last five years.
Don't Forget: The P/E Does Not Account For Debt or Bank Deposits
Don't forget that the P/E ratio considers market capitalization. Thus, the metric does not reflect cash or debt held by the company. Theoretically, a business can improve its earnings (and produce a lower P/E in the future) by investing in growth. That means taking on debt (or spending its cash).
Such expenditure might be good or bad, in the long term, but the point here is that the balance sheet is not reflected by this ratio.
How Does Fiat Chrysler Automobiles's Debt Impact Its P/E Ratio?
Fiat Chrysler Automobiles has net cash of €2.5b. This is fairly high at 14% of its market capitalization. That might mean balance sheet strength is important to the business, but should also help push the P/E a bit higher than it would otherwise be.
The Bottom Line On Fiat Chrysler Automobiles's P/E Ratio
Fiat Chrysler Automobiles trades on a P/E ratio of 5.9, which is below the IT market average of 15.7. Falling earnings per share are likely to be keeping potential buyers away, but the net cash position means the company has time to improve: if so, the low P/E could be an opportunity.
When the market is wrong about a stock, it gives savvy investors an opportunity. If the reality for a company is not as bad as the P/E ratio indicates, then the share price should increase as the market realizes this. So this free report on the analyst consensus forecasts could help you make a master move on this stock.
But note: Fiat Chrysler Automobiles may not be the best stock to buy. So take a peek at this free list of interesting companies with strong recent earnings growth (and a P/E ratio below 20).
We aim to bring you long-term focused research analysis driven by fundamental data. Note that our analysis may not factor in the latest price-sensitive company announcements or qualitative material.
If you spot an error that warrants correction, please contact the editor at editorial-team@simplywallst.com. This article by Simply Wall St is general in nature. It does not constitute a recommendation to buy or sell any stock, and does not take account of your objectives, or your financial situation. Simply Wall St has no position in the stocks mentioned. Thank you for reading.
