Here's What Level One Bancorp, Inc.'s (NASDAQ:LEVL) P/E Is Telling Us

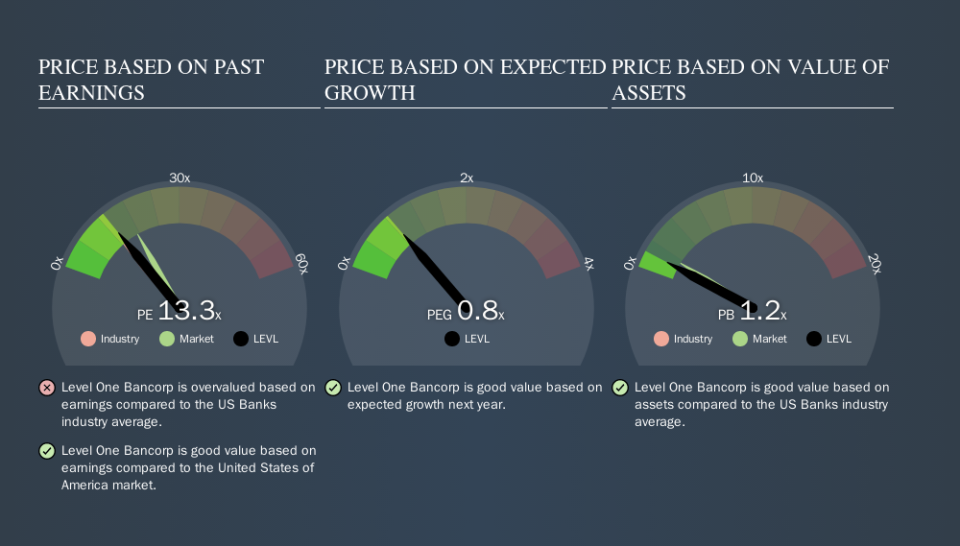
This article is written for those who want to get better at using price to earnings ratios (P/E ratios). We'll show how you can use Level One Bancorp, Inc.'s (NASDAQ:LEVL) P/E ratio to inform your assessment of the investment opportunity. Based on the last twelve months, Level One Bancorp's P/E ratio is 13.29. That corresponds to an earnings yield of approximately 7.5%.
Check out our latest analysis for Level One Bancorp
How Do I Calculate A Price To Earnings Ratio?
The formula for P/E is:
Price to Earnings Ratio = Share Price ÷ Earnings per Share (EPS)
Or for Level One Bancorp:
P/E of 13.29 = $24.48 ÷ $1.84 (Based on the year to June 2019.)
Is A High P/E Ratio Good?
The higher the P/E ratio, the higher the price tag of a business, relative to its trailing earnings. That is not a good or a bad thing per se, but a high P/E does imply buyers are optimistic about the future.
Does Level One Bancorp Have A Relatively High Or Low P/E For Its Industry?
We can get an indication of market expectations by looking at the P/E ratio. You can see in the image below that the average P/E (12.4) for companies in the banks industry is roughly the same as Level One Bancorp's P/E.
Level One Bancorp's P/E tells us that market participants think its prospects are roughly in line with its industry. So if Level One Bancorp actually outperforms its peers going forward, that should be a positive for the share price. Checking factors such as director buying and selling. could help you form your own view on if that will happen.
How Growth Rates Impact P/E Ratios
If earnings fall then in the future the 'E' will be lower. Therefore, even if you pay a low multiple of earnings now, that multiple will become higher in the future. So while a stock may look cheap based on past earnings, it could be expensive based on future earnings.
Most would be impressed by Level One Bancorp earnings growth of 13% in the last year. And earnings per share have improved by 25% annually, over the last five years. So one might expect an above average P/E ratio. But earnings per share are down 2.2% per year over the last three years.
Don't Forget: The P/E Does Not Account For Debt or Bank Deposits
Don't forget that the P/E ratio considers market capitalization. That means it doesn't take debt or cash into account. In theory, a company can lower its future P/E ratio by using cash or debt to invest in growth.
Spending on growth might be good or bad a few years later, but the point is that the P/E ratio does not account for the option (or lack thereof).
Level One Bancorp's Balance Sheet
Level One Bancorp has net debt worth 22% of its market capitalization. It would probably deserve a higher P/E ratio if it was net cash, since it would have more options for growth.
The Verdict On Level One Bancorp's P/E Ratio
Level One Bancorp has a P/E of 13.3. That's below the average in the US market, which is 17.4. The EPS growth last year was strong, and debt levels are quite reasonable. The low P/E ratio suggests current market expectations are muted, implying these levels of growth will not continue. Because analysts are predicting more growth in the future, one might have expected to see a higher P/E ratio. You can take a closer look at the fundamentals, here.
When the market is wrong about a stock, it gives savvy investors an opportunity. As value investor Benjamin Graham famously said, 'In the short run, the market is a voting machine but in the long run, it is a weighing machine. So this free report on the analyst consensus forecasts could help you make a master move on this stock.
You might be able to find a better buy than Level One Bancorp. If you want a selection of possible winners, check out this free list of interesting companies that trade on a P/E below 20 (but have proven they can grow earnings).
We aim to bring you long-term focused research analysis driven by fundamental data. Note that our analysis may not factor in the latest price-sensitive company announcements or qualitative material.
If you spot an error that warrants correction, please contact the editor at editorial-team@simplywallst.com. This article by Simply Wall St is general in nature. It does not constitute a recommendation to buy or sell any stock, and does not take account of your objectives, or your financial situation. Simply Wall St has no position in the stocks mentioned. Thank you for reading.
