Here's What LleidaNetworks Serveis Telemàtics, S.A.'s (BME:LLN) P/E Is Telling Us

This article is for investors who would like to improve their understanding of price to earnings ratios (P/E ratios). We'll show how you can use LleidaNetworks Serveis Telemàtics, S.A.'s (BME:LLN) P/E ratio to inform your assessment of the investment opportunity. Based on the last twelve months, LleidaNetworks Serveis Telemàtics's P/E ratio is 42.92. In other words, at today's prices, investors are paying €42.92 for every €1 in prior year profit.
See our latest analysis for LleidaNetworks Serveis Telemàtics
How Do I Calculate A Price To Earnings Ratio?
The formula for P/E is:
Price to Earnings Ratio = Share Price ÷ Earnings per Share (EPS)
Or for LleidaNetworks Serveis Telemàtics:
P/E of 42.92 = €0.78 ÷ €0.018 (Based on the year to December 2018.)
Is A High P/E Ratio Good?
A higher P/E ratio means that investors are paying a higher price for each €1 of company earnings. That is not a good or a bad thing per se, but a high P/E does imply buyers are optimistic about the future.
Does LleidaNetworks Serveis Telemàtics Have A Relatively High Or Low P/E For Its Industry?
We can get an indication of market expectations by looking at the P/E ratio. The image below shows that LleidaNetworks Serveis Telemàtics has a higher P/E than the average (23.2) P/E for companies in the telecom industry.
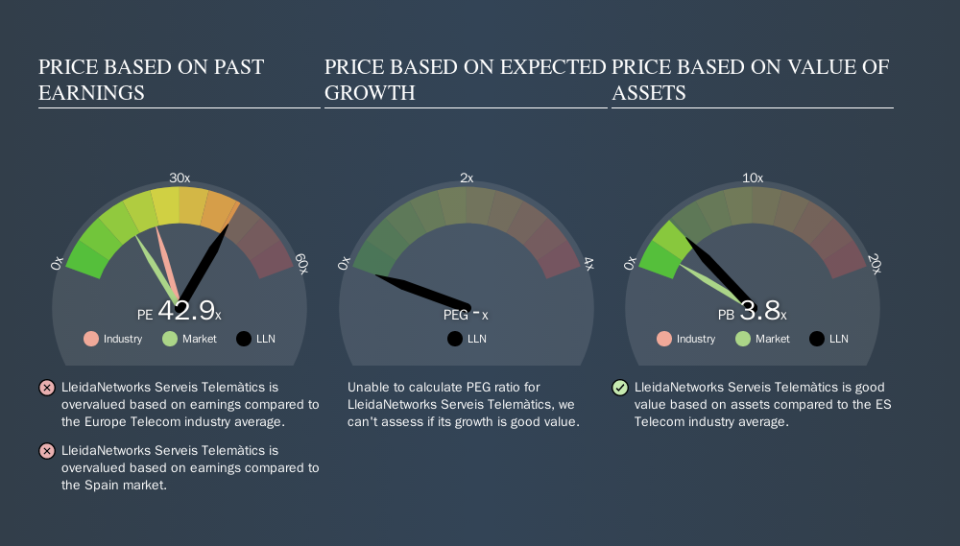
That means that the market expects LleidaNetworks Serveis Telemàtics will outperform other companies in its industry. Shareholders are clearly optimistic, but the future is always uncertain. So investors should always consider the P/E ratio alongside other factors, such as whether company directors have been buying shares.
How Growth Rates Impact P/E Ratios
Generally speaking the rate of earnings growth has a profound impact on a company's P/E multiple. When earnings grow, the 'E' increases, over time. And in that case, the P/E ratio itself will drop rather quickly. And as that P/E ratio drops, the company will look cheap, unless its share price increases.
LleidaNetworks Serveis Telemàtics's 359% EPS improvement over the last year was like bamboo growth after rain; rapid and impressive.
Don't Forget: The P/E Does Not Account For Debt or Bank Deposits
The 'Price' in P/E reflects the market capitalization of the company. In other words, it does not consider any debt or cash that the company may have on the balance sheet. Theoretically, a business can improve its earnings (and produce a lower P/E in the future) by investing in growth. That means taking on debt (or spending its cash).
Such spending might be good or bad, overall, but the key point here is that you need to look at debt to understand the P/E ratio in context.
LleidaNetworks Serveis Telemàtics's Balance Sheet
Net debt totals 13% of LleidaNetworks Serveis Telemàtics's market cap. This could bring some additional risk, and reduce the number of investment options for management; worth remembering if you compare its P/E to businesses without debt.
The Bottom Line On LleidaNetworks Serveis Telemàtics's P/E Ratio
LleidaNetworks Serveis Telemàtics trades on a P/E ratio of 42.9, which is above its market average of 16.6. Its debt levels do not imperil its balance sheet and its EPS growth is very healthy indeed. So on this analysis a high P/E ratio seems reasonable.
Investors should be looking to buy stocks that the market is wrong about. People often underestimate remarkable growth -- so investors can make money when fast growth is not fully appreciated. We don't have analyst forecasts, but shareholders might want to examine this detailed historical graph of earnings, revenue and cash flow.
Of course you might be able to find a better stock than LleidaNetworks Serveis Telemàtics. So you may wish to see this free collection of other companies that have grown earnings strongly.
We aim to bring you long-term focused research analysis driven by fundamental data. Note that our analysis may not factor in the latest price-sensitive company announcements or qualitative material.
If you spot an error that warrants correction, please contact the editor at editorial-team@simplywallst.com. This article by Simply Wall St is general in nature. It does not constitute a recommendation to buy or sell any stock, and does not take account of your objectives, or your financial situation. Simply Wall St has no position in the stocks mentioned. Thank you for reading.
