Here's What M/I Homes, Inc.'s (NYSE:MHO) P/E Ratio Is Telling Us

Want to participate in a research study? Help shape the future of investing tools and earn a $60 gift card!
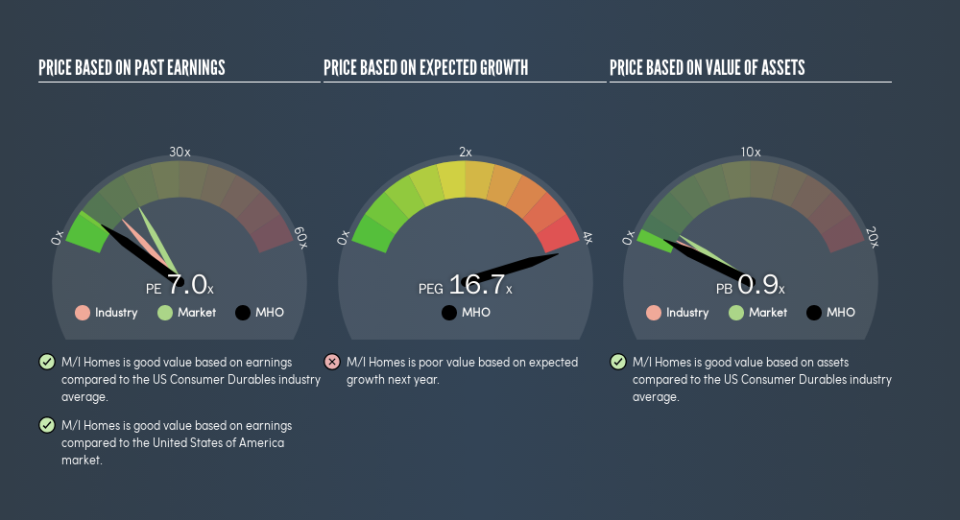
The goal of this article is to teach you how to use price to earnings ratios (P/E ratios). To keep it practical, we'll show how M/I Homes, Inc.'s (NYSE:MHO) P/E ratio could help you assess the value on offer. M/I Homes has a price to earnings ratio of 6.98, based on the last twelve months. That means that at current prices, buyers pay $6.98 for every $1 in trailing yearly profits.
View our latest analysis for M/I Homes
How Do You Calculate A P/E Ratio?
The formula for P/E is:
Price to Earnings Ratio = Share Price ÷ Earnings per Share (EPS)
Or for M/I Homes:
P/E of 6.98 = $26.62 ÷ $3.81 (Based on the trailing twelve months to December 2018.)
Is A High P/E Ratio Good?
A higher P/E ratio means that buyers have to pay a higher price for each $1 the company has earned over the last year. That is not a good or a bad thing per se, but a high P/E does imply buyers are optimistic about the future.
How Growth Rates Impact P/E Ratios
Earnings growth rates have a big influence on P/E ratios. That's because companies that grow earnings per share quickly will rapidly increase the 'E' in the equation. That means even if the current P/E is high, it will reduce over time if the share price stays flat. Then, a lower P/E should attract more buyers, pushing the share price up.
M/I Homes increased earnings per share by a whopping 49% last year. And its annual EPS growth rate over 3 years is 22%. So we'd generally expect it to have a relatively high P/E ratio. In contrast, EPS has decreased by 11%, annually, over 5 years.
How Does M/I Homes's P/E Ratio Compare To Its Peers?
The P/E ratio indicates whether the market has higher or lower expectations of a company. The image below shows that M/I Homes has a lower P/E than the average (11.8) P/E for companies in the consumer durables industry.
This suggests that market participants think M/I Homes will underperform other companies in its industry. Many investors like to buy stocks when the market is pessimistic about their prospects. It is arguably worth checking if insiders are buying shares, because that might imply they believe the stock is undervalued.
Don't Forget: The P/E Does Not Account For Debt or Bank Deposits
Don't forget that the P/E ratio considers market capitalization. Thus, the metric does not reflect cash or debt held by the company. In theory, a company can lower its future P/E ratio by using cash or debt to invest in growth.
Such expenditure might be good or bad, in the long term, but the point here is that the balance sheet is not reflected by this ratio.
M/I Homes's Balance Sheet
M/I Homes's net debt is considerable, at 109% of its market cap. This is a relatively high level of debt, so the stock probably deserves a relatively low P/E ratio. Keep that in mind when comparing it to other companies.
The Bottom Line On M/I Homes's P/E Ratio
M/I Homes's P/E is 7 which is below average (17.7) in the US market. The company may have significant debt, but EPS growth was good last year. The low P/E ratio suggests current market expectations are muted, implying these levels of growth will not continue.
When the market is wrong about a stock, it gives savvy investors an opportunity. If the reality for a company is not as bad as the P/E ratio indicates, then the share price should increase as the market realizes this. So this free report on the analyst consensus forecasts could help you make a master move on this stock.
Of course you might be able to find a better stock than M/I Homes. So you may wish to see this free collection of other companies that have grown earnings strongly.
We aim to bring you long-term focused research analysis driven by fundamental data. Note that our analysis may not factor in the latest price-sensitive company announcements or qualitative material.
If you spot an error that warrants correction, please contact the editor at editorial-team@simplywallst.com. This article by Simply Wall St is general in nature. It does not constitute a recommendation to buy or sell any stock, and does not take account of your objectives, or your financial situation. Simply Wall St has no position in the stocks mentioned. Thank you for reading.
