Here's What Overseas Education Limited's (SGX:RQ1) P/E Ratio Is Telling Us

Today, we'll introduce the concept of the P/E ratio for those who are learning about investing. We'll apply a basic P/E ratio analysis to Overseas Education Limited's (SGX:RQ1), to help you decide if the stock is worth further research. What is Overseas Education's P/E ratio? Well, based on the last twelve months it is 16.98. In other words, at today's prices, investors are paying SGD16.98 for every SGD1 in prior year profit.
Check out our latest analysis for Overseas Education
How Do I Calculate A Price To Earnings Ratio?
The formula for price to earnings is:
Price to Earnings Ratio = Share Price ÷ Earnings per Share (EPS)
Or for Overseas Education:
P/E of 16.98 = SGD0.29 ÷ SGD0.017 (Based on the trailing twelve months to March 2019.)
Is A High Price-to-Earnings Ratio Good?
The higher the P/E ratio, the higher the price tag of a business, relative to its trailing earnings. That isn't necessarily good or bad, but a high P/E implies relatively high expectations of what a company can achieve in the future.
How Does Overseas Education's P/E Ratio Compare To Its Peers?
We can get an indication of market expectations by looking at the P/E ratio. As you can see below Overseas Education has a P/E ratio that is fairly close for the average for the consumer services industry, which is 17.1.
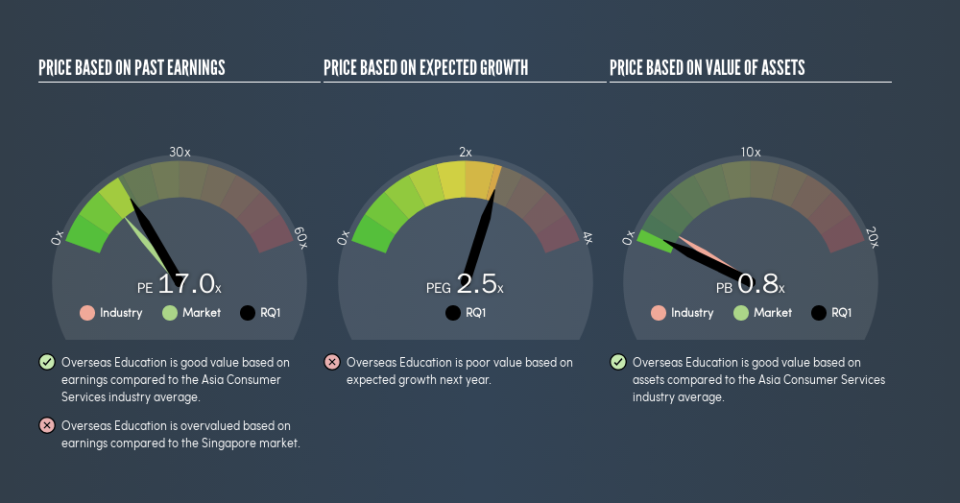
That indicates that the market expects Overseas Education will perform roughly in line with other companies in its industry. If the company has better than average prospects, then the market might be underestimating it. Checking factors such as director buying and selling. could help you form your own view on if that will happen.
How Growth Rates Impact P/E Ratios
When earnings fall, the 'E' decreases, over time. Therefore, even if you pay a low multiple of earnings now, that multiple will become higher in the future. So while a stock may look cheap based on past earnings, it could be expensive based on future earnings.
Overseas Education's earnings per share grew by -7.0% in the last twelve months. But earnings per share are down 21% per year over the last five years.
Remember: P/E Ratios Don't Consider The Balance Sheet
It's important to note that the P/E ratio considers the market capitalization, not the enterprise value. Thus, the metric does not reflect cash or debt held by the company. Theoretically, a business can improve its earnings (and produce a lower P/E in the future) by investing in growth. That means taking on debt (or spending its cash).
While growth expenditure doesn't always pay off, the point is that it is a good option to have; but one that the P/E ratio ignores.
Overseas Education's Balance Sheet
Overseas Education has net debt worth 66% of its market capitalization. If you want to compare its P/E ratio to other companies, you should absolutely keep in mind it has significant borrowings.
The Verdict On Overseas Education's P/E Ratio
Overseas Education has a P/E of 17. That's higher than the average in its market, which is 12.8. With meaningful debt and only modest recent earnings growth, the market is either expecting reliable long-term growth, or a near-term improvement.
Investors should be looking to buy stocks that the market is wrong about. As value investor Benjamin Graham famously said, 'In the short run, the market is a voting machine but in the long run, it is a weighing machine.' So this free visual report on analyst forecasts could hold the key to an excellent investment decision.
But note: Overseas Education may not be the best stock to buy. So take a peek at this free list of interesting companies with strong recent earnings growth (and a P/E ratio below 20).
We aim to bring you long-term focused research analysis driven by fundamental data. Note that our analysis may not factor in the latest price-sensitive company announcements or qualitative material.
If you spot an error that warrants correction, please contact the editor at editorial-team@simplywallst.com. This article by Simply Wall St is general in nature. It does not constitute a recommendation to buy or sell any stock, and does not take account of your objectives, or your financial situation. Simply Wall St has no position in the stocks mentioned. Thank you for reading.
