Here's How P/E Ratios Can Help Us Understand Masimo Corporation (NASDAQ:MASI)

Want to participate in a short research study? Help shape the future of investing tools and you could win a $250 gift card!
Today, we'll introduce the concept of the P/E ratio for those who are learning about investing. We'll show how you can use Masimo Corporation's (NASDAQ:MASI) P/E ratio to inform your assessment of the investment opportunity. What is Masimo's P/E ratio? Well, based on the last twelve months it is 39.96. That is equivalent to an earnings yield of about 2.5%.
See our latest analysis for Masimo
How Do I Calculate A Price To Earnings Ratio?
The formula for P/E is:
Price to Earnings Ratio = Share Price ÷ Earnings per Share (EPS)
Or for Masimo:
P/E of 39.96 = $149.63 ÷ $3.74 (Based on the trailing twelve months to March 2019.)
Is A High Price-to-Earnings Ratio Good?
A higher P/E ratio implies that investors pay a higher price for the earning power of the business. That is not a good or a bad thing per se, but a high P/E does imply buyers are optimistic about the future.
How Growth Rates Impact P/E Ratios
Generally speaking the rate of earnings growth has a profound impact on a company's P/E multiple. When earnings grow, the 'E' increases, over time. That means even if the current P/E is high, it will reduce over time if the share price stays flat. Then, a lower P/E should attract more buyers, pushing the share price up.
Masimo's earnings made like a rocket, taking off 63% last year. The cherry on top is that the five year growth rate was an impressive 27% per year. With that kind of growth rate we would generally expect a high P/E ratio.
Does Masimo Have A Relatively High Or Low P/E For Its Industry?
The P/E ratio indicates whether the market has higher or lower expectations of a company. The image below shows that Masimo has a P/E ratio that is roughly in line with the medical equipment industry average (42).
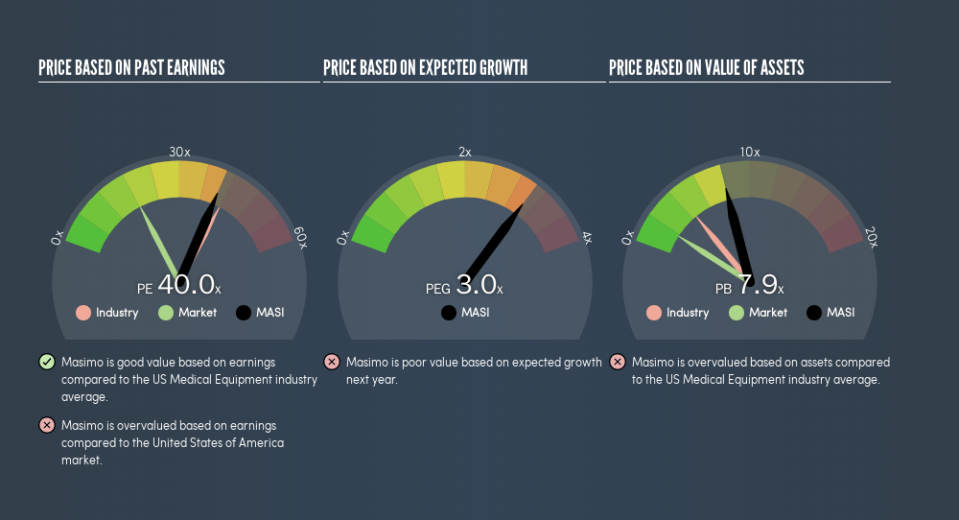
That indicates that the market expects Masimo will perform roughly in line with other companies in its industry. The company could surprise by performing better than average, in the future. I would further inform my view by checking insider buying and selling., among other things.
Don't Forget: The P/E Does Not Account For Debt or Bank Deposits
It's important to note that the P/E ratio considers the market capitalization, not the enterprise value. In other words, it does not consider any debt or cash that the company may have on the balance sheet. Hypothetically, a company could reduce its future P/E ratio by spending its cash (or taking on debt) to achieve higher earnings.
While growth expenditure doesn't always pay off, the point is that it is a good option to have; but one that the P/E ratio ignores.
Is Debt Impacting Masimo's P/E?
Since Masimo holds net cash of US$593m, it can spend on growth, justifying a higher P/E ratio than otherwise.
The Bottom Line On Masimo's P/E Ratio
Masimo trades on a P/E ratio of 40, which is above the US market average of 18.2. The excess cash it carries is the gravy on top its fast EPS growth. So based on this analysis we'd expect Masimo to have a high P/E ratio.
Investors have an opportunity when market expectations about a stock are wrong. If the reality for a company is better than it expects, you can make money by buying and holding for the long term. So this free visual report on analyst forecasts could hold the key to an excellent investment decision.
But note: Masimo may not be the best stock to buy. So take a peek at this free list of interesting companies with strong recent earnings growth (and a P/E ratio below 20).
We aim to bring you long-term focused research analysis driven by fundamental data. Note that our analysis may not factor in the latest price-sensitive company announcements or qualitative material.
If you spot an error that warrants correction, please contact the editor at editorial-team@simplywallst.com. This article by Simply Wall St is general in nature. It does not constitute a recommendation to buy or sell any stock, and does not take account of your objectives, or your financial situation. Simply Wall St has no position in the stocks mentioned. Thank you for reading.
