Here's How P/E Ratios Can Help Us Understand Scales Corporation Limited (NZSE:SCL)

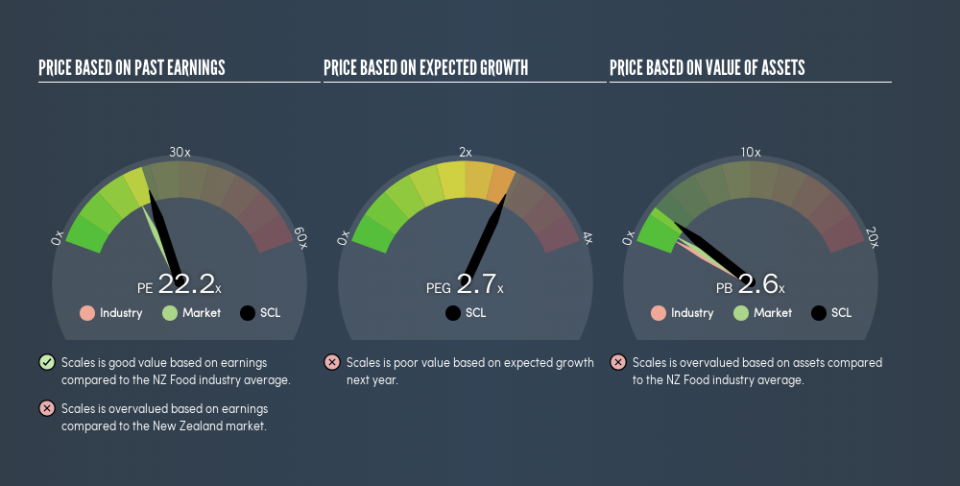
This article is for investors who would like to improve their understanding of price to earnings ratios (P/E ratios). We'll show how you can use Scales Corporation Limited's (NZSE:SCL) P/E ratio to inform your assessment of the investment opportunity. What is Scales's P/E ratio? Well, based on the last twelve months it is 22.2. That corresponds to an earnings yield of approximately 4.5%.
See our latest analysis for Scales
How Do I Calculate A Price To Earnings Ratio?
The formula for P/E is:
Price to Earnings Ratio = Share Price ÷ Earnings per Share (EPS)
Or for Scales:
P/E of 22.2 = NZ$4.54 ÷ NZ$0.20 (Based on the year to December 2018.)
Is A High Price-to-Earnings Ratio Good?
A higher P/E ratio implies that investors pay a higher price for the earning power of the business. All else being equal, it's better to pay a low price -- but as Warren Buffett said, 'It's far better to buy a wonderful company at a fair price than a fair company at a wonderful price.'
How Does Scales's P/E Ratio Compare To Its Peers?
The P/E ratio essentially measures market expectations of a company. The image below shows that Scales has a P/E ratio that is roughly in line with the food industry average (22.4).
Its P/E ratio suggests that Scales shareholders think that in the future it will perform about the same as other companies in its industry classification. The company could surprise by performing better than average, in the future. Checking factors such as director buying and selling. could help you form your own view on if that will happen.
How Growth Rates Impact P/E Ratios
If earnings fall then in the future the 'E' will be lower. That means even if the current P/E is low, it will increase over time if the share price stays flat. Then, a higher P/E might scare off shareholders, pushing the share price down.
Most would be impressed by Scales earnings growth of 18% in the last year. And it has bolstered its earnings per share by 4.9% per year over the last five years. With that performance, you might expect an above average P/E ratio. Unfortunately, earnings per share are down 7.3% a year, over 3 years.
Don't Forget: The P/E Does Not Account For Debt or Bank Deposits
Don't forget that the P/E ratio considers market capitalization. Thus, the metric does not reflect cash or debt held by the company. Theoretically, a business can improve its earnings (and produce a lower P/E in the future) by investing in growth. That means taking on debt (or spending its cash).
Such spending might be good or bad, overall, but the key point here is that you need to look at debt to understand the P/E ratio in context.
So What Does Scales's Balance Sheet Tell Us?
Net debt totals 11% of Scales's market cap. That's enough debt to impact the P/E ratio a little; so keep it in mind if you're comparing it to companies without debt.
The Bottom Line On Scales's P/E Ratio
Scales has a P/E of 22.2. That's higher than the average in its market, which is 18.9. While the company does use modest debt, its recent earnings growth is very good. Therefore, it's not particularly surprising that it has a above average P/E ratio.
Investors have an opportunity when market expectations about a stock are wrong. If the reality for a company is better than it expects, you can make money by buying and holding for the long term. So this free report on the analyst consensus forecasts could help you make a master move on this stock.
Of course you might be able to find a better stock than Scales. So you may wish to see this free collection of other companies that have grown earnings strongly.
We aim to bring you long-term focused research analysis driven by fundamental data. Note that our analysis may not factor in the latest price-sensitive company announcements or qualitative material.
If you spot an error that warrants correction, please contact the editor at editorial-team@simplywallst.com. This article by Simply Wall St is general in nature. It does not constitute a recommendation to buy or sell any stock, and does not take account of your objectives, or your financial situation. Simply Wall St has no position in the stocks mentioned. Thank you for reading.
