Here's How P/E Ratios Can Help Us Understand Assured Guaranty Ltd. (NYSE:AGO)

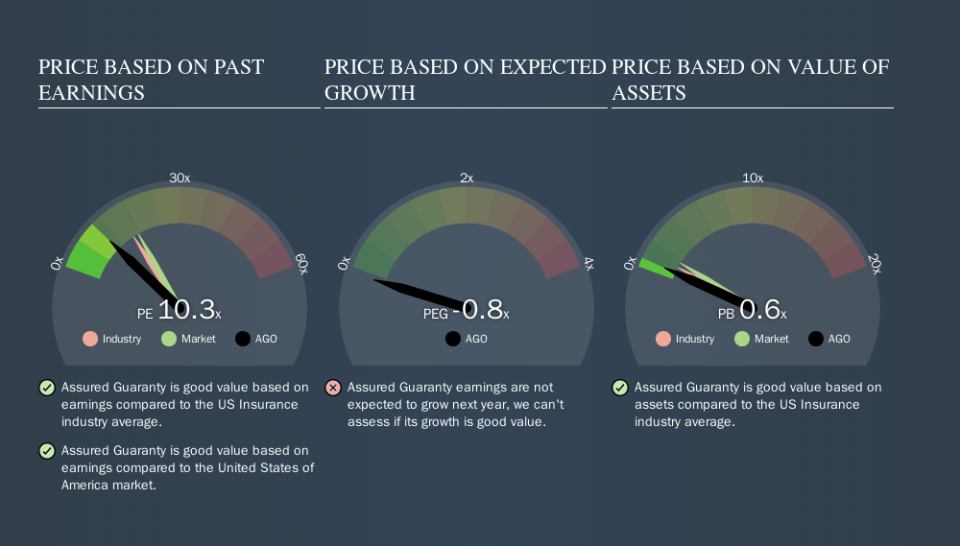
The goal of this article is to teach you how to use price to earnings ratios (P/E ratios). To keep it practical, we'll show how Assured Guaranty Ltd.'s (NYSE:AGO) P/E ratio could help you assess the value on offer. Looking at earnings over the last twelve months, Assured Guaranty has a P/E ratio of 10.28. In other words, at today's prices, investors are paying $10.28 for every $1 in prior year profit.
Check out our latest analysis for Assured Guaranty
How Do I Calculate A Price To Earnings Ratio?
The formula for price to earnings is:
Price to Earnings Ratio = Share Price ÷ Earnings per Share (EPS)
Or for Assured Guaranty:
P/E of 10.28 = $43.75 ÷ $4.25 (Based on the year to June 2019.)
Is A High Price-to-Earnings Ratio Good?
A higher P/E ratio means that buyers have to pay a higher price for each $1 the company has earned over the last year. That isn't a good or a bad thing on its own, but a high P/E means that buyers have a higher opinion of the business's prospects, relative to stocks with a lower P/E.
How Does Assured Guaranty's P/E Ratio Compare To Its Peers?
One good way to get a quick read on what market participants expect of a company is to look at its P/E ratio. If you look at the image below, you can see Assured Guaranty has a lower P/E than the average (16.0) in the insurance industry classification.
Its relatively low P/E ratio indicates that Assured Guaranty shareholders think it will struggle to do as well as other companies in its industry classification. Since the market seems unimpressed with Assured Guaranty, it's quite possible it could surprise on the upside. You should delve deeper. I like to check if company insiders have been buying or selling.
How Growth Rates Impact P/E Ratios
If earnings fall then in the future the 'E' will be lower. That means unless the share price falls, the P/E will increase in a few years. Then, a higher P/E might scare off shareholders, pushing the share price down.
Assured Guaranty saw earnings per share decrease by 7.3% last year. And over the longer term (5 years) earnings per share have decreased 3.7% annually. So it would be surprising to see a high P/E.
Don't Forget: The P/E Does Not Account For Debt or Bank Deposits
It's important to note that the P/E ratio considers the market capitalization, not the enterprise value. So it won't reflect the advantage of cash, or disadvantage of debt. Theoretically, a business can improve its earnings (and produce a lower P/E in the future) by investing in growth. That means taking on debt (or spending its cash).
Such expenditure might be good or bad, in the long term, but the point here is that the balance sheet is not reflected by this ratio.
How Does Assured Guaranty's Debt Impact Its P/E Ratio?
Since Assured Guaranty holds net cash of US$116m, it can spend on growth, justifying a higher P/E ratio than otherwise.
The Bottom Line On Assured Guaranty's P/E Ratio
Assured Guaranty's P/E is 10.3 which is below average (17.6) in the US market. The recent drop in earnings per share would make investors cautious, the relatively strong balance sheet will allow the company time to invest in growth. If it achieves that, then there's real potential that the low P/E could eventually indicate undervaluation.
When the market is wrong about a stock, it gives savvy investors an opportunity. If the reality for a company is not as bad as the P/E ratio indicates, then the share price should increase as the market realizes this. So this free visual report on analyst forecasts could hold the key to an excellent investment decision.
But note: Assured Guaranty may not be the best stock to buy. So take a peek at this free list of interesting companies with strong recent earnings growth (and a P/E ratio below 20).
We aim to bring you long-term focused research analysis driven by fundamental data. Note that our analysis may not factor in the latest price-sensitive company announcements or qualitative material.
If you spot an error that warrants correction, please contact the editor at editorial-team@simplywallst.com. This article by Simply Wall St is general in nature. It does not constitute a recommendation to buy or sell any stock, and does not take account of your objectives, or your financial situation. Simply Wall St has no position in the stocks mentioned. Thank you for reading.
