Here's What Van Elle Holdings plc's (LON:VANL) P/E Ratio Is Telling Us

Want to participate in a short research study? Help shape the future of investing tools and you could win a $250 gift card!
This article is written for those who want to get better at using price to earnings ratios (P/E ratios). To keep it practical, we'll show how Van Elle Holdings plc's (LON:VANL) P/E ratio could help you assess the value on offer. What is Van Elle Holdings's P/E ratio? Well, based on the last twelve months it is 6.59. That corresponds to an earnings yield of approximately 15%.
See our latest analysis for Van Elle Holdings
How Do I Calculate A Price To Earnings Ratio?
The formula for price to earnings is:
Price to Earnings Ratio = Price per Share ÷ Earnings per Share (EPS)
Or for Van Elle Holdings:
P/E of 6.59 = £0.41 ÷ £0.062 (Based on the year to October 2018.)
Is A High P/E Ratio Good?
A higher P/E ratio means that buyers have to pay a higher price for each £1 the company has earned over the last year. All else being equal, it's better to pay a low price -- but as Warren Buffett said, 'It's far better to buy a wonderful company at a fair price than a fair company at a wonderful price.'
Does Van Elle Holdings Have A Relatively High Or Low P/E For Its Industry?
We can get an indication of market expectations by looking at the P/E ratio. We can see in the image below that the average P/E (8.2) for companies in the construction industry is higher than Van Elle Holdings's P/E.
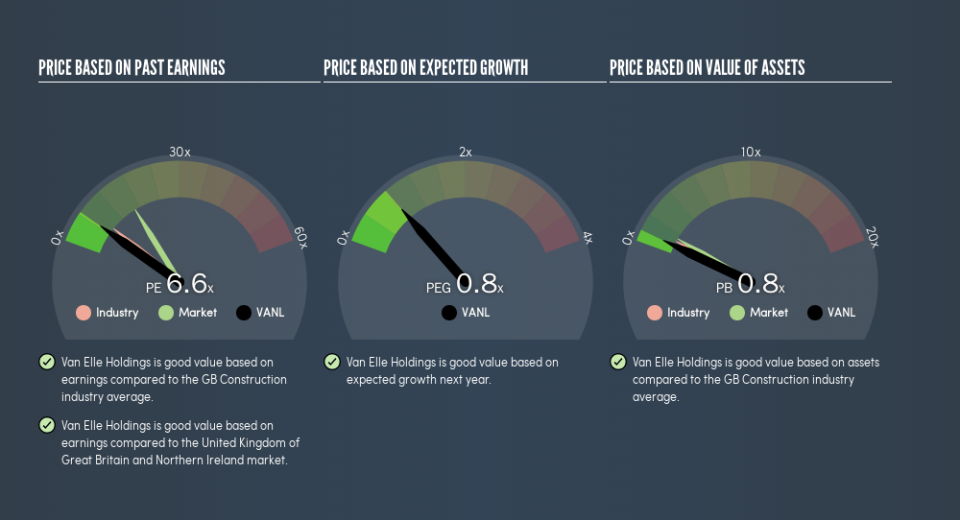
This suggests that market participants think Van Elle Holdings will underperform other companies in its industry. Since the market seems unimpressed with Van Elle Holdings, it's quite possible it could surprise on the upside. You should delve deeper. I like to check if company insiders have been buying or selling.
How Growth Rates Impact P/E Ratios
When earnings fall, the 'E' decreases, over time. Therefore, even if you pay a low multiple of earnings now, that multiple will become higher in the future. So while a stock may look cheap based on past earnings, it could be expensive based on future earnings.
Van Elle Holdings saw earnings per share decrease by 47% last year. And it has shrunk its earnings per share by 43% per year over the last five years. This might lead to muted expectations.
Remember: P/E Ratios Don't Consider The Balance Sheet
The 'Price' in P/E reflects the market capitalization of the company. Thus, the metric does not reflect cash or debt held by the company. Theoretically, a business can improve its earnings (and produce a lower P/E in the future) by investing in growth. That means taking on debt (or spending its cash).
Such expenditure might be good or bad, in the long term, but the point here is that the balance sheet is not reflected by this ratio.
So What Does Van Elle Holdings's Balance Sheet Tell Us?
Net debt totals 17% of Van Elle Holdings's market cap. That's enough debt to impact the P/E ratio a little; so keep it in mind if you're comparing it to companies without debt.
The Verdict On Van Elle Holdings's P/E Ratio
Van Elle Holdings has a P/E of 6.6. That's below the average in the GB market, which is 16.5. With only modest debt, it's likely the lack of EPS growth at least partially explains the pessimism implied by the P/E ratio.
Investors have an opportunity when market expectations about a stock are wrong. If it is underestimating a company, investors can make money by buying and holding the shares until the market corrects itself. So this free visual report on analyst forecasts could hold the key to an excellent investment decision.
But note: Van Elle Holdings may not be the best stock to buy. So take a peek at this free list of interesting companies with strong recent earnings growth (and a P/E ratio below 20).
We aim to bring you long-term focused research analysis driven by fundamental data. Note that our analysis may not factor in the latest price-sensitive company announcements or qualitative material.
If you spot an error that warrants correction, please contact the editor at editorial-team@simplywallst.com. This article by Simply Wall St is general in nature. It does not constitute a recommendation to buy or sell any stock, and does not take account of your objectives, or your financial situation. Simply Wall St has no position in the stocks mentioned. Thank you for reading.
