Hextar Industries Berhad (KLSE:HEXIND) Stock Has Shown Weakness Lately But Financials Look Strong: Should Prospective Shareholders Make The Leap?
Hextar Industries Berhad (KLSE:HEXIND) has had a rough three months with its share price down 11%. However, a closer look at its sound financials might cause you to think again. Given that fundamentals usually drive long-term market outcomes, the company is worth looking at. Specifically, we decided to study Hextar Industries Berhad's ROE in this article.
Return on equity or ROE is an important factor to be considered by a shareholder because it tells them how effectively their capital is being reinvested. Put another way, it reveals the company's success at turning shareholder investments into profits.
Check out our latest analysis for Hextar Industries Berhad
How Is ROE Calculated?
ROE can be calculated by using the formula:
Return on Equity = Net Profit (from continuing operations) ÷ Shareholders' Equity
So, based on the above formula, the ROE for Hextar Industries Berhad is:
12% = RM42m ÷ RM340m (Based on the trailing twelve months to December 2023).
The 'return' is the amount earned after tax over the last twelve months. One way to conceptualize this is that for each MYR1 of shareholders' capital it has, the company made MYR0.12 in profit.
Why Is ROE Important For Earnings Growth?
So far, we've learned that ROE is a measure of a company's profitability. We now need to evaluate how much profit the company reinvests or "retains" for future growth which then gives us an idea about the growth potential of the company. Assuming all else is equal, companies that have both a higher return on equity and higher profit retention are usually the ones that have a higher growth rate when compared to companies that don't have the same features.
Hextar Industries Berhad's Earnings Growth And 12% ROE
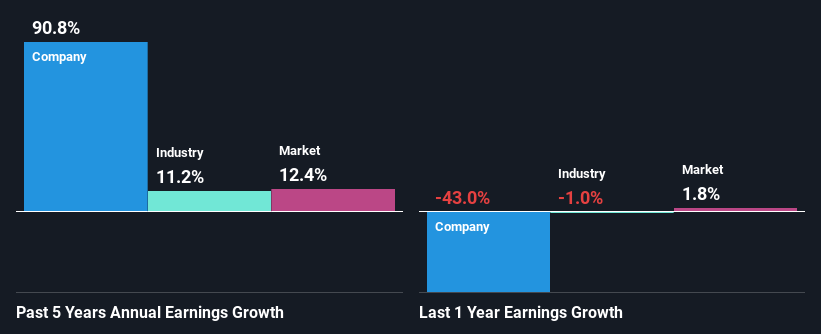
To start with, Hextar Industries Berhad's ROE looks acceptable. Especially when compared to the industry average of 6.4% the company's ROE looks pretty impressive. This certainly adds some context to Hextar Industries Berhad's exceptional 91% net income growth seen over the past five years. However, there could also be other causes behind this growth. For example, it is possible that the company's management has made some good strategic decisions, or that the company has a low payout ratio.
As a next step, we compared Hextar Industries Berhad's net income growth with the industry, and pleasingly, we found that the growth seen by the company is higher than the average industry growth of 11%.
Earnings growth is an important metric to consider when valuing a stock. The investor should try to establish if the expected growth or decline in earnings, whichever the case may be, is priced in. By doing so, they will have an idea if the stock is headed into clear blue waters or if swampy waters await. Is Hextar Industries Berhad fairly valued compared to other companies? These 3 valuation measures might help you decide.
Is Hextar Industries Berhad Using Its Retained Earnings Effectively?
The high three-year median payout ratio of 78% (implying that it keeps only 22% of profits) for Hextar Industries Berhad suggests that the company's growth wasn't really hampered despite it returning most of the earnings to its shareholders.
Besides, Hextar Industries Berhad has been paying dividends for at least ten years or more. This shows that the company is committed to sharing profits with its shareholders.
Conclusion
In total, we are pretty happy with Hextar Industries Berhad's performance. In particular, its high ROE is quite noteworthy and also the probable explanation behind its considerable earnings growth. Yet, the company is retaining a small portion of its profits. Which means that the company has been able to grow its earnings in spite of it, so that's not too bad. So far, we've only made a quick discussion around the company's earnings growth. To gain further insights into Hextar Industries Berhad's past profit growth, check out this visualization of past earnings, revenue and cash flows.
Have feedback on this article? Concerned about the content? Get in touch with us directly. Alternatively, email editorial-team (at) simplywallst.com.
This article by Simply Wall St is general in nature. We provide commentary based on historical data and analyst forecasts only using an unbiased methodology and our articles are not intended to be financial advice. It does not constitute a recommendation to buy or sell any stock, and does not take account of your objectives, or your financial situation. We aim to bring you long-term focused analysis driven by fundamental data. Note that our analysis may not factor in the latest price-sensitive company announcements or qualitative material. Simply Wall St has no position in any stocks mentioned.
