History Shows The S&P 500 Can Keep Going Up From Here (SPY)
From Chris Ciovacco: A common bearish argument making the rounds over the past year goes something like this: “Stocks have been rising for over eight years; they can’t keep going up.”
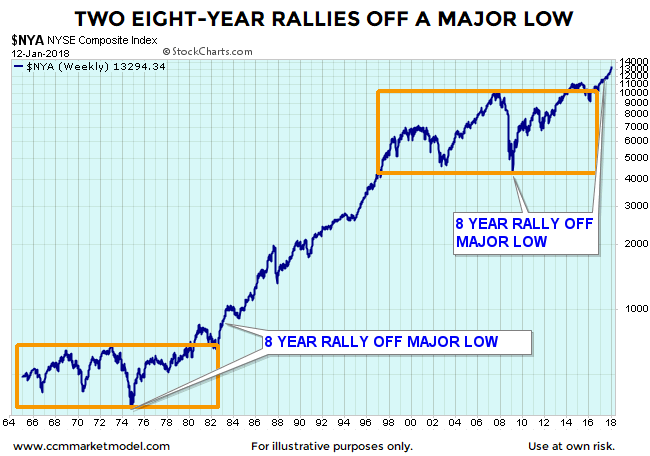
As shown in the NYSE Composite chart below, stocks rallied for eight years off a major low in 1974, broke out to a new all-time high, and then subsequently rallied for an additional 18 years. In present day, stocks rallied off the 2009 major low and broke out in 2017 making a new all-time high.
WHAT HAPPENED NEXT?
Given humans tend to extrapolate the recent past into the future, many expect the next major move for the markets in 2018 is a 50%-plus bear market similar to the 2000-2002 and 2007-2009 periods. That is not what happened after the similar historical setup in the early 1980s. Instead of following the 1964-1980 script, stocks tacked on an additional gain of over 700% (see chart below).

BUT, WHAT ABOUT VALUATIONS?
If we are to take the “all the charts are meaningless because of valuations” argument seriously, we must convince ourselves that valuations were a useful timing tool between 1964 and the stock market peak in 2000.
A FAIR AND FACT-BASED ASSESSMENT
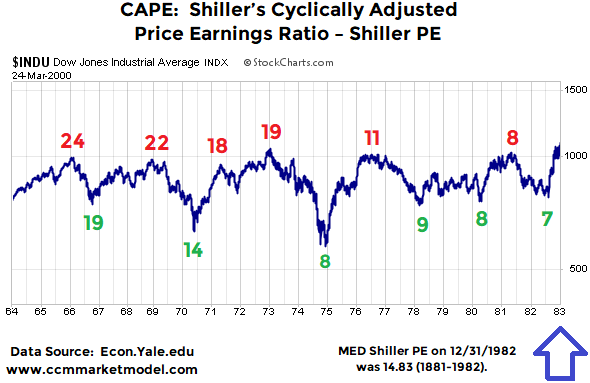
In order to make a prudent assessment of the real-world utility of valuations, we must review the information that was available as stocks marched higher between the end of 1982 and 2000. For example, when stocks broke out to a new all-time high in 1982, the median Shiller PE or CAPE ratio looking backwards (1881-1982) was 14.83.
This week’s video takes a detailed look at two periods, 1992-2000 and 1956-2000, to evaluate the effectiveness of attempting to use the Shiller PE or CAPE ratio as a market timing tool. In the video, Shiller PEs are reviewed on stock charts, allowing you to draw your own fact-based conclusions.
To view the video in full screen mode, click the square icon in the lower right corner of the video player. To exit full screen mode, hit the Esc key (escape).
LONG-TERM MEANS LONG-TERM
Just as there was normal and sometimes gut-wrenching volatility between 1983 and 2000, even if better than expected outcomes occur over the next 3-20 years, volatility will be part of the equation.
The SPDR S&P 500 ETF Trust (SPY) was trading at $278.79 per share on Tuesday morning, up $0.87 (+0.31%). Year-to-date, SPY has gained 4.47%.
SPY currently has an ETF Daily News SMART Grade of A (Strong Buy), and is ranked #1 of 141 ETFs in the Large Cap Blend ETFs category.
This article is brought to you courtesy of Ciovacco Capital.
