History Suggests Stock Weakness Could Be Ahead
Stocks were moving along smoothly, then last Wednesday the S&P 500 Index (SPX) dropped about 1%, followed by a 1.6% drop on Thursday. It was the first two-day drop of more than 2.5% since March. This has made some investors nervous about the future of the stock market. In this article, I will examine historical instances of two-day declines like this to see if they tend to lead to sharp selloffs or buying opportunities.
Past 2-Day Drops
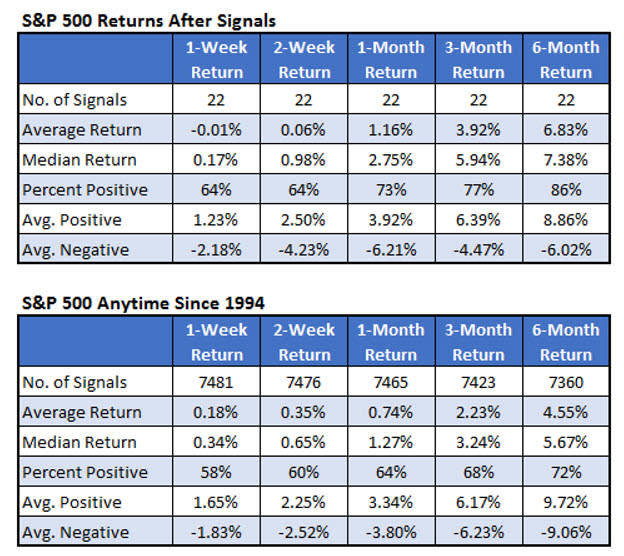
For this analysis, I went back to 1990 and found times that the SPX fell by 2.5% over a two-day period, with it being the first such drop in at least six months. There were 22 prior instances, with the first one occurring in 1994, and the last one in September 2021.
Based on the numbers below, there tends to be initial weakness, which looks to be the case this time as well. Once you get to a month after these signals, however, the SPX has done better than what is typical.
In our database, we have daily theoretical figures on how a one-week and one-month option would have performed. The theoretical option returns use actual implied volatilities to calculate a price of an at-the-money option that expires in a week and in a month. We calculate the return of the option based on the stock price over the corresponding timeframe. For the option returns, I use the SPRD S&P 500 ETF Trust (SPY), which is an ETF with very liquid options that tracks the SPX.
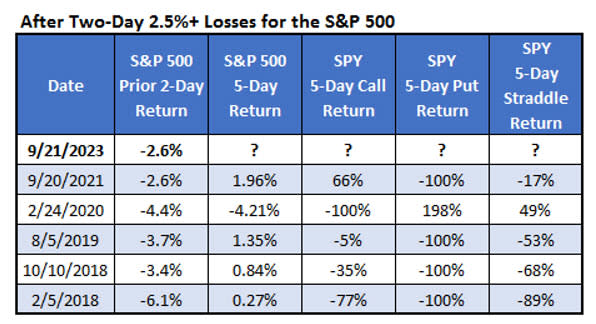
The table below shows how the five-day options would have fared after each of the signals that occurred since 2018 (that’s when we have the option return data). The SPX was up after four of the last five signals. In three out of four of those instances, the index did not move up enough to cover the cost of an at-the-money call option. The one time the SPX fell was right at the beginning of the Covid-19 pandemic. That would have led to a huge put option return of about 200%.
The table below is like the one above, except it looks at returns over the next month instead of just the next week. Buying a one-month call option would have been profitable with a 74% gain after the last signal in September 2021. Buying calls overall, however, would have led to an average loss of 11% per trade.
The signal in 2020 just before Covid-19 resulted in a 24% loss of the SPX, giving a SPY put option holder a return of over 900% for just that one trade. Playing straddles after each signal would have led to four losses and only one winning trade. The leverage of options, however, would have made it a winning strategy overall with the average return of 47% per straddle trade.

