HOMB’s Balance Sheet Continues to Weather the Storm

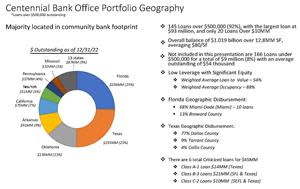
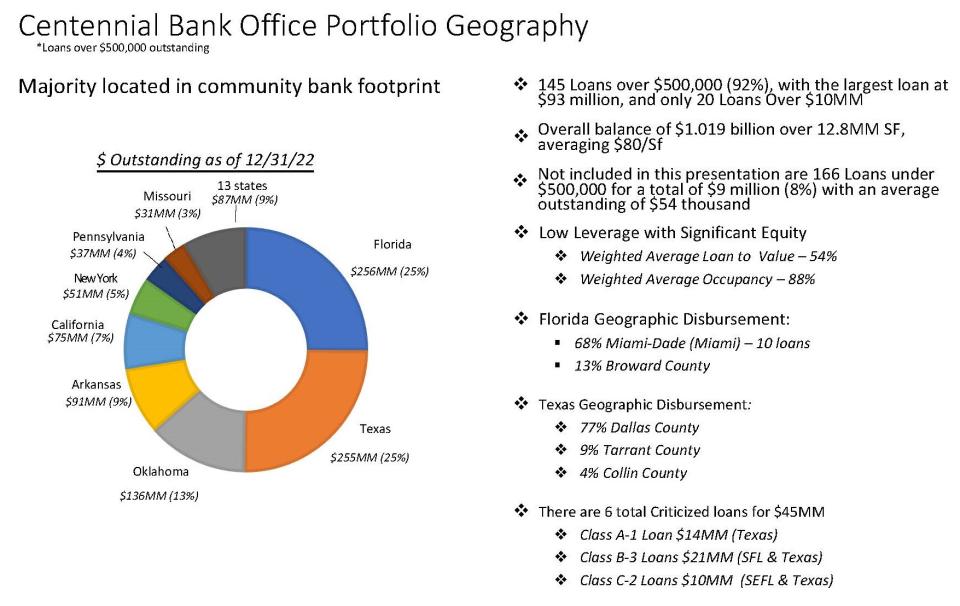
Centennial Bank Office Portfolio Geography
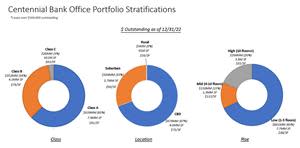
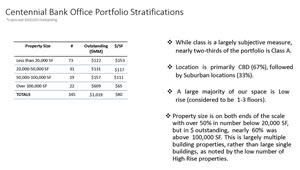
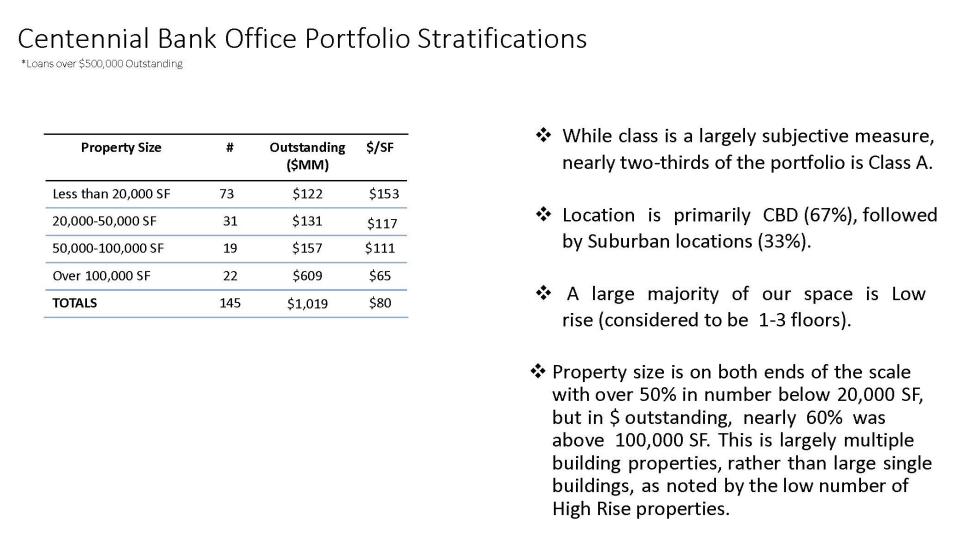
Centennial Bank Office Portfolio Stratifications
Centennial Bank Office Portfolio Stratifications - Part 2
CONWAY, Ark., April 20, 2023 (GLOBE NEWSWIRE) -- Home BancShares, Inc. (NYSE: HOMB) (“Home” or the “Company”), parent company of Centennial Bank, released quarterly earnings today.
Highlights of the First Quarter of 2023:
Metric | Q1 2023 | Q4 2022 | Q3 2022 | Q2 2022 | Q1 2022 |
Net income | $103.0 million | $115.7 million | $108.7 million | $16.0 million | $64.9 million |
Total revenue (net) | $248.8 million | $272.3 million | $256.3 million | $243.3 million | $161.8 million |
Income before income taxes | $132.9 million | $148.4 million | $142.0 million | $19.3 million | $84.9 million |
Pre-tax, pre-provision, net income (PPNR) | $134.1 million | $153.4 million | $142.0 million | $77.9 million | $84.9 million |
Pre-tax net income to total revenue (net) | 53.43% | 54.50% | 55.39% | 7.92% | 52.48% |
P5NR (Pre-tax, pre-provision, profit percentage) (PPNR to total revenue (net)) (non-GAAP)(1) | 53.91% | 56.34% | 55.39% | 32.00% | 52.48% |
ROA | 1.84% | 1.98% | 1.81% | 0.26% | 1.43% |
NIM | 4.37% | 4.21% | 4.05% | 3.64% | 3.21% |
Purchase accounting accretion | $3.2 million | $3.5 million | $4.6 million | $5.2 million | $3.1 million |
ROE | 11.70% | 13.29% | 12.25% | 1.78% | 9.58% |
ROTCE (non-GAAP)(1) | 19.75% | 22.96% | 20.93% | 2.96% | 15.03% |
Diluted earnings per share | $0.51 | $0.57 | $0.53 | $0.08 | $0.40 |
Non-performing assets to total assets | 0.33% | 0.27% | 0.27% | 0.25% | 0.25% |
Common equity tier 1 capital | 13.2% | 12.9% | 13.0% | 12.8% | 14.9% |
Leverage | 11.4% | 10.9% | 10.4% | 9.8% | 10.8% |
Tier 1 capital | 13.2% | 12.9% | 13.0% | 12.9% | 15.5% |
Total risk-based capital | 16.8% | 16.5% | 16.7% | 16.6% | 21.6% |
Allowance for credit losses to total loans | 2.00% | 2.01% | 2.09% | 2.11% | 2.34% |
(1) Calculation of this metric and the reconciliation to GAAP are included in the schedules accompanying this release.
“The strength of Home BancShares’ liquidity and availability provides more than 100% coverage for all uninsured and uncollateralized depositors as of March 31, 2023,” stated John Allison, Chairman and CEO of HOMB. “The strong liquidity of HOMB would have allowed HOMB to pay all uninsured and uncollateralized deposits in excess of the FDIC limits of $250,000 and still have $1.7 billion remaining,” Allison continued.
“We are very proud of the fortress balance sheet we have built at Home BancShares. Home BancShares with its wholly-owned subsidiary Centennial Bank is one of the strongest financial institutions in America. There are only a handful of banks in the country that can make that statement. Our strength and liquidity have put HOMB in an enviable position,” Allison added.
“As the banking environment continues to be volatile, our ability to pay uninsured and uncollateralized deposits at Centennial Bank and deliver strong earnings for our shareholders is nothing less than remarkable,” said Tracy French, President and CEO of Centennial Bank.
Liquidity and Funding Sources
At March 31, 2023, the Company held $2.74 billion in net available internal liquidity. This balance consisted of $2.15 billion in unpledged investment securities which could be used for additional secured borrowing capacity, $407.2 million in cash with the Federal Reserve Bank (FRB) and $185.9 million in other liquid cash accounts.
Consistent with the Company’s practice of maintaining access to significant external liquidity, the Company had $4.18 billion in net available external liquidity as of March 31, 2023. This included $5.20 billion in available liquidity with the Federal Home Loan Bank (FHLB), of which $1.80 billion has been drawn upon in the ordinary course of business, resulting in $3.40 billion in net available liquidity with the FHLB as of March 31, 2023. The $1.80 billion consisted of $650.0 million in outstanding FHLB advances and $1.15 billion used for pledging purposes. The Company also had access to approximately $677.7 million in liquidity with the FRB as of March 31, 2023. This consisted of $71.8 million available from the Discount Window and $605.9 million available through the Bank Term Funding Program (BTFP). As of March 31, 2023, the Company also had access to $55.0 million from First National Bankers’ Bank (FNBB), and $45.0 million from other various external sources.
Overall, the Company had $6.92 billion net available liquidity as of March 31, 2023, which consisted of $2.74 billion of net available internal liquidity and $4.18 billion in net available external liquidity. Details on the Company’s available liquidity as of March 31, 2023 is available below.
(in thousands) |
| Total Available |
| Amount Used |
| Net Availability | |||
Internal Sources |
|
|
|
|
|
| |||
Unpledged investment securities (market value) |
| $ | 2,150,186 |
| $ | — |
| $ | 2,150,186 |
Cash at FRB |
|
| 407,210 |
|
| — |
|
| 407,210 |
Other liquid cash accounts |
|
| 185,943 |
|
| — |
|
| 185,943 |
Total Internal Liquidity |
|
| 2,743,339 |
|
| — |
|
| 2,743,339 |
External Sources |
|
|
|
|
|
| |||
FHLB |
|
| 5,201,603 |
|
| 1,798,490 |
|
| 3,403,113 |
FRB Discount Window |
|
| 71,755 |
|
| — |
|
| 71,755 |
BTFP (par value) |
|
| 605,896 |
|
| — |
|
| 605,896 |
FNBB |
|
| 55,000 |
|
| — |
|
| 55,000 |
Other |
|
| 45,000 |
|
| — |
|
| 45,000 |
Total External Liquidity |
|
| 5,979,254 |
|
| 1,798,490 |
|
| 4,180,764 |
Total Available Liquidity |
| $ | 8,722,593 |
| $ | 1,798,490 |
| $ | 6,924,103 |
The Company has continued to limit its exposure to uninsured deposits and has been actively monitoring this in light of the current banking environment. As of March 31, 2023, the Company held approximately $7.89 billion in uninsured deposits of which $2.68 billion were collateralized deposits, for a net position of $5.21 billion. This represents approximately 29.9% of total deposits. In addition, net available liquidity exceeded uninsured and uncollateralized deposits by $1.71 billion.
(in thousands) | As of | |
Uninsured Deposits | $ | 7,892,121 |
Collateralized Deposits |
| 2,683,804 |
Net Uninsured Position | $ | 5,208,317 |
|
| |
Total Available Liquidity | $ | 6,924,103 |
Net Uninsured Position |
| 5,208,317 |
Net Available Liquidity in Excess of Uninsured Deposits | $ | 1,715,786 |
In the event the Company’s $5.21 billion net position of uninsured deposits had been called by depositors during the first quarter of 2023, the Company estimates that interest expense would have increased by approximately $64.2 million for the period ended March 31, 2023, assuming the event occurred on January 1, 2023. The outflow of deposits could have been funded through available sources of liquidity. In this event, the Company estimates that it would still have achieved return on average assets (ROA) of 1.21% for the period ended March 31, 2023.
Subsequent to the end of the quarter, the Company made the decision to pledge additional investment securities with a market value of $761.5 million in order to increase the Company’s BTFP borrowing capacity by $825.5 million, which represents the par value of the pledged investment securities. This increased the net available liquidity exceeding uninsured deposits by $64.0 million.
Operating Highlights
Net income for the three-month period ended March 31, 2023 was $103.0 million, or $0.51 diluted earnings per share. When adjusting for non-fundamental items, net income and diluted earnings per share on an as-adjusted basis (non-GAAP), was $108.9 million(1), or $0.54 per share(1) for the three months ended March 31, 2023.
Our net interest margin was 4.37% for the three-month period ended March 31, 2023, compared to 4.21% for the three-month period ended December 31, 2022. The yield on loans was 6.64% and 6.23% for the three months ended March 31, 2023 and December 31, 2022, respectively, as average loans increased from $14.11 billion to $14.47 billion. Additionally, the rate on interest bearing deposits increased to 1.90% as of March 31, 2023, from 1.45% as of December 31, 2022, while average interest-bearing balances decreased from $12.85 billion to $12.65 billion.
During the first quarter of 2023, there was $2.1 million of event interest income compared to event interest income of $871,000 for the fourth quarter of 2022.
Purchase accounting accretion on acquired loans was $3.2 million and $3.5 million and average purchase accounting loan discounts were $35.5 million and $38.6 million for the three-month periods ended March 31, 2023 and December 31, 2022, respectively.
Net interest income on a fully taxable equivalent basis was $216.2 million for the three-month period ended March 31, 2023, and $217.7 million for the three-month period ended December 31, 2022. This reduction in net interest income for the three-month period ended March 31, 2023, was the result of a $13.1 million increase in interest expense, partially offset by an $11.7 million increase in interest income. The $13.1 million increase in interest expense was due to a $12.1 million increase in interest expense on deposits and an $802,000 increase in interest expense on FHLB borrowed funds. The increase in interest expense on deposits and FHLB borrowed funds is a result of the rising interest rate environment. The $11.7 million increase in interest income was primarily the result of a $15.6 million increase in loan interest income and a $1.5 million increase in investment income, partially offset by a $5.4 million decrease in income from interest-bearing balances due from banks. The increase in interest income is a result of the rising interest rate environment as well as an increase in average loan balances during the quarter.
The Company reported $34.2 million of non-interest income for the first quarter of 2023. The most important components of first quarter non-interest income were $11.9 million from other income, $11.9 million from other service charges and fees, $9.8 million from service charges on deposit accounts, $4.9 million from trust fees, $2.8 million from dividends from FHLB, FRB, FNBB and other, $2.6 million in mortgage lending income and a $1.1 million increase in cash value of life insurance, partially offset by an $11.4 million fair value adjustment for marketable securities. The $11.9 million in other income includes $3.5 million in recoveries on historic losses.
Non-interest expense for the first quarter of 2023 was $114.6 million. The most important components of non-interest expense were $64.5 million from salaries and employee benefits, $26.2 million in other operating expense, $15.0 million in occupancy and equipment expenses and $9.0 million in data processing expenses. For the first quarter of 2023, our efficiency ratio was 44.80%; and our efficiency ratio, as adjusted (non-GAAP), was 43.42%(1).
Financial Condition
Total loans receivable were $14.39 billion at March 31, 2023, compared to $14.41 billion at December 31, 2022. Total deposits were $17.45 billion at March 31, 2023, compared to $17.94 billion at December 31, 2022. Total assets were $22.52 billion at March 31, 2023, compared to $22.88 billion at December 31, 2022.
During the first quarter of 2023, the Company experienced approximately $22.8 million in loan decline. Centennial CFG experienced $94.6 million of organic loan decline and had loans of $2.18 billion at March 31, 2023. Our remaining footprint experienced $73.9 million in organic loan growth and $2.1 million in PPP loan decline during the quarter.
Non-performing loans to total loans was 0.51% and 0.42% at March 31, 2023 and December 31, 2022, respectively. Non-performing assets to total assets was 0.33% and 0.27% at March 31, 2023 and December 31, 2022, respectively. Net charge-offs were $3.7 million and $4.5 million for the three months ended March 31, 2023 and December 31, 2022, respectively.
Non-performing loans at March 31, 2023 were $11.2 million, $20.0 million, $26.9 million, $390,000, $2.1 million and $13.4 million in the Arkansas, Florida, Texas, Alabama, Shore Premier Finance and Centennial CFG markets, respectively, for a total of $74.0 million. Non-performing assets at March 31, 2023 were $11.2 million, $20.2 million, $27.2 million, $390,000, $2.1 million and $13.4 million in the Arkansas, Florida, Texas, Alabama, Shore Premier Finance and Centennial CFG markets, respectively, for a total of $74.5 million.
The Company’s allowance for credit losses on loans was $287.2 million at March 31, 2023, or 2.00% of total loans, compared to the allowance for credit losses on loans of $289.7 million, or 2.01% of total loans, at December 31, 2022. As of March 31, 2023 and December 31, 2022, the Company’s allowance for credit losses on loans was 388.23% and 475.99% of its total non-performing loans, respectively.
Stockholders’ equity was $3.63 billion at March 31, 2023, compared to $3.53 billion at December 31, 2022, an increase of approximately $104.5 million. The increase in stockholders’ equity is primarily associated with the $66.3 million increase in retained earnings and the $49.2 million decrease in accumulated other comprehensive loss, which were partially offset by $13.5 million in stock repurchases. Book value per common share was $17.87 at March 31, 2023, compared to $17.33 at December 31, 2022. Tangible book value per common share (non-GAAP) was $10.71(1) at March 31, 2023, compared to $10.17(1) at December 31, 2022.
Office Loan Portfolio Detail
The following charts and graphs provide additional information related to our loan portfolio secured by commercial office space, which represents an aggregate outstanding principal balance of $1.03 billion, or 7.1% of our total loans receivable as of December 31, 2022.

Branches
The Company currently has 76 branches in Arkansas, 78 branches in Florida, 63 branches in Texas, 5 branches in Alabama and one branch in New York City.
Conference Call
Management will conduct a conference call to review this information at 1:00 p.m. CT (2:00 p.m. ET) on Thursday, April 20, 2023. We strongly encourage all participants to pre-register for the conference call webcast or the live call using one of the following links. First, participants can pre-register for the conference call webcast using the following link: https://events.q4inc.com/attendee/775702912. Participants who pre-register will be given a unique webcast link to gain immediate access to the conference call webcast. Second, participants can pre-register for the live call using the following link: https://www.netroadshow.com/events/login?show=a2c2eedd&confId=48539. Participants who pre-register will be given the phone number and unique access codes to gain immediate access to the live call. Participants may pre-register now, or at any time prior to the call, and will immediately receive simple instructions via email. The Home BancShares conference call will also be scheduled as an event in your Outlook calendar.
Those without internet access or unable to pre-register may dial in and listen to the live call by calling 1-833-470-1428, Passcode: 716837. A replay of the call will be available by calling 1-866-813-9403, Passcode: 964704, which will be available until April 27, 2023, at 10:59 p.m. CT (11:59 p.m. ET). Internet access to the call will be available live or in recorded version on the Company's website at www.homebancshares.com.
About Home BancShares
Home BancShares, Inc. is a bank holding company, headquartered in Conway, Arkansas. Its wholly-owned subsidiary, Centennial Bank, provides a broad range of commercial and retail banking plus related financial services to businesses, real estate developers, investors, individuals and municipalities. Centennial Bank has branch locations in Arkansas, Florida, Texas, South Alabama and New York City. The Company’s common stock is traded through the New York Stock Exchange under the symbol “HOMB.” The Company was founded in 1998. Visit www.homebancshares.com or www.my100bank.com for more information.
(1) Calculation of this metric and the reconciliation to GAAP are included in the schedules accompanying this release.
Non-GAAP Financial Measures
This press release contains financial information determined by methods other than in accordance with generally accepted accounting principles (GAAP). The Company’s management uses these non-GAAP financial measures--including net income (earnings), as adjusted; pre-tax, pre-provision, net income (PPNR); PPNR, as adjusted; pre-tax net income, as adjusted, to total revenue (net); pre-tax, pre-provision, profit percentage; pre-tax, pre-provision, profit percentage, as adjusted; diluted earnings per common share, as adjusted; return on average assets, as adjusted; return on average assets excluding intangible amortization; return on average assets, as adjusted, excluding intangible amortization; return on average common equity, as adjusted; return on average tangible common equity; return on average tangible common equity, as adjusted; return on average tangible common equity excluding intangible amortization; return on average tangible common equity, as adjusted, excluding intangible amortization; efficiency ratio, as adjusted; tangible book value per common share and tangible common equity to tangible assets--to provide meaningful supplemental information regarding our performance. These measures typically adjust GAAP performance measures to include the tax benefit associated with revenue items that are tax-exempt, as well as adjust income available to common shareholders for certain significant items or transactions that management believes are not indicative of the Company’s primary business operating results. Since the presentation of these GAAP performance measures and their impact differ between companies, management believes presentations of these non-GAAP financial measures provide useful supplemental information that is essential to a proper understanding of the operating results of the Company’s business. These non-GAAP disclosures should not be viewed as a substitute for operating results determined in accordance with GAAP, nor are they necessarily comparable to non-GAAP performance measures that may be presented by other companies. Where non-GAAP financial measures are used, the comparable GAAP financial measure, as well as the reconciliation to the comparable GAAP financial measure, can be found in the tables of this release.
General
This release may contain forward-looking statements regarding the Company’s plans, expectations, goals and outlook for the future. Statements in this press release that are not historical facts should be considered forward-looking statements within the meaning of the Private Securities Litigation Reform Act of 1995. Forward-looking statements are not guarantees of future events, performance or results. When we use words like “may,” “plan,” “propose,” “contemplate,” “anticipate,” “believe,” “intend,” “continue,” “expect,” “project,” “predict,” “estimate,” “could,” “should,” “would,” and similar expressions, you should consider them as identifying forward-looking statements, although we may use other phrasing. Forward-looking statements of this type speak only as of the date of this news release. By nature, forward-looking statements involve inherent risks and uncertainties. Various factors could cause actual results to differ materially from those contemplated by the forward-looking statements. These factors include, but are not limited to, the following: economic conditions, credit quality, interest rates, loan demand, real estate values and unemployment, including the ongoing impacts of inflation; disruptions, uncertainties and related effects on our business and operations that may result from any future outbreaks of the COVID-19 pandemic, including the impact on, among other things, credit quality and liquidity; the ability to identify, complete and successfully integrate new acquisitions; the risk that expected cost savings and other benefits from acquisitions may not be fully realized or may take longer to realize than expected; diversion of management time on acquisition-related issues; the availability of and access to capital and liquidity on terms acceptable to us; legislative and regulatory changes and risks and expenses associated with current and future legislation and regulations; technological changes and cybersecurity risks and incidents; the effects of changes in accounting policies and practices; changes in governmental monetary and fiscal policies; political instability, military conflicts and other major domestic or international events; adverse weather events, including hurricanes, and other natural disasters; competition from other financial institutions; potential claims, expenses and other adverse effects related to current or future litigation, regulatory examinations or other government actions; potential increases in deposit insurance assessments, increased regulatory scrutiny or market disruptions resulting from financial challenges in the banking industry; changes in the assumptions used in making the forward-looking statements; and other factors described in reports we file with the Securities and Exchange Commission (the “SEC”), including those factors set forth in our Annual Report on Form 10-K for the year ended December 31, 2022, filed with the SEC on February 24, 2023.
FOR MORE INFORMATION CONTACT:
Donna Townsell
Director of Investor Relations
Home BancShares, Inc.
(501) 328-4625
| ||||||||||||||||||||
Home BancShares, Inc. | ||||||||||||||||||||
Consolidated End of Period Balance Sheets | ||||||||||||||||||||
(Unaudited) | ||||||||||||||||||||
|
|
|
|
|
|
|
|
|
|
| ||||||||||
(In thousands) |
| Mar. 31, 2023 |
| Dec. 31, 2022 |
| Sep. 30, 2022 |
| Jun. 30, 2022 |
| Mar. 31, 2022 | ||||||||||
ASSETS |
|
|
|
|
|
|
|
|
|
| ||||||||||
Cash and due from banks |
| $ | 250,841 |
|
| $ | 263,893 |
|
| $ | 268,929 |
|
| $ | 287,451 |
|
| $ | 173,134 |
|
Interest-bearing deposits with other banks |
|
| 437,213 |
|
|
| 460,897 |
|
|
| 1,311,492 |
|
|
| 2,528,925 |
|
|
| 3,446,324 |
|
Cash and cash equivalents |
|
| 688,054 |
|
|
| 724,790 |
|
|
| 1,580,421 |
|
|
| 2,816,376 |
|
|
| 3,619,458 |
|
Federal funds sold |
|
| — |
|
|
| — |
|
|
| 2,700 |
|
|
| — |
|
|
| — |
|
Investment securities - available-for sale, net of allowance for credit losses |
|
| 3,772,138 |
|
|
| 4,041,590 |
|
|
| 4,085,102 |
|
|
| 3,791,509 |
|
|
| 2,957,322 |
|
Investment securities - held-to-maturity, net of allowance for credit losses |
|
| 1,286,373 |
|
|
| 1,287,705 |
|
|
| 1,251,007 |
|
|
| 1,366,781 |
|
|
| 499,265 |
|
Total investment securities |
|
| 5,058,511 |
|
|
| 5,329,295 |
|
|
| 5,336,109 |
|
|
| 5,158,290 |
|
|
| 3,456,587 |
|
Loans receivable |
|
| 14,386,634 |
|
|
| 14,409,480 |
|
|
| 13,829,311 |
|
|
| 13,923,873 |
|
|
| 10,052,714 |
|
Allowance for credit losses |
|
| (287,169 | ) |
|
| (289,669 | ) |
|
| (289,203 | ) |
|
| (294,267 | ) |
|
| (234,768 | ) |
Loans receivable, net |
|
| 14,099,465 |
|
|
| 14,119,811 |
|
|
| 13,540,108 |
|
|
| 13,629,606 |
|
|
| 9,817,946 |
|
Bank premises and equipment, net |
|
| 402,094 |
|
|
| 405,073 |
|
|
| 411,479 |
|
|
| 415,056 |
|
|
| 274,503 |
|
Foreclosed assets held for sale |
|
| 425 |
|
|
| 546 |
|
|
| 365 |
|
|
| 373 |
|
|
| 1,144 |
|
Cash value of life insurance |
|
| 214,792 |
|
|
| 213,693 |
|
|
| 212,619 |
|
|
| 211,811 |
|
|
| 105,623 |
|
Accrued interest receivable |
|
| 102,740 |
|
|
| 103,199 |
|
|
| 88,671 |
|
|
| 80,274 |
|
|
| 46,934 |
|
Deferred tax asset, net |
|
| 193,334 |
|
|
| 209,321 |
|
|
| 228,979 |
|
|
| 208,585 |
|
|
| 116,605 |
|
Goodwill |
|
| 1,398,253 |
|
|
| 1,398,253 |
|
|
| 1,394,353 |
|
|
| 1,398,400 |
|
|
| 973,025 |
|
Core deposit intangible |
|
| 55,978 |
|
|
| 58,455 |
|
|
| 60,932 |
|
|
| 63,410 |
|
|
| 23,624 |
|
Other assets |
|
| 304,609 |
|
|
| 321,152 |
|
|
| 300,634 |
|
|
| 270,987 |
|
|
| 182,546 |
|
Total assets |
| $ | 22,518,255 |
|
| $ | 22,883,588 |
|
| $ | 23,157,370 |
|
| $ | 24,253,168 |
|
| $ | 18,617,995 |
|
|
|
|
|
|
|
|
|
|
|
| ||||||||||
LIABILITIES AND STOCKHOLDERS' EQUITY |
|
|
|
|
|
|
|
|
|
| ||||||||||
Liabilities |
|
|
|
|
|
|
|
|
|
| ||||||||||
Deposits: |
|
|
|
|
|
|
|
|
|
| ||||||||||
Demand and non-interest-bearing |
| $ | 4,945,729 |
|
| $ | 5,164,997 |
|
| $ | 5,540,539 |
|
| $ | 6,036,583 |
|
| $ | 4,311,400 |
|
Savings and interest-bearing transaction accounts |
|
| 11,392,566 |
|
|
| 11,730,552 |
|
|
| 11,968,519 |
|
|
| 12,424,192 |
|
|
| 9,461,393 |
|
Time deposits |
|
| 1,107,171 |
|
|
| 1,043,234 |
|
|
| 1,033,266 |
|
|
| 1,119,297 |
|
|
| 808,141 |
|
Total deposits |
|
| 17,445,466 |
|
|
| 17,938,783 |
|
|
| 18,542,324 |
|
|
| 19,580,072 |
|
|
| 14,580,934 |
|
Securities sold under agreements to repurchase |
|
| 138,742 |
|
|
| 131,146 |
|
|
| 121,555 |
|
|
| 118,573 |
|
|
| 151,151 |
|
FHLB and other borrowed funds |
|
| 650,000 |
|
|
| 650,000 |
|
|
| 400,000 |
|
|
| 400,000 |
|
|
| 400,000 |
|
Accrued interest payable and other liabilities |
|
| 212,887 |
|
|
| 196,877 |
|
|
| 192,908 |
|
|
| 197,503 |
|
|
| 131,339 |
|
Subordinated debentures |
|
| 440,275 |
|
|
| 440,420 |
|
|
| 440,568 |
|
|
| 458,455 |
|
|
| 667,868 |
|
Total liabilities |
|
| 18,887,370 |
|
|
| 19,357,226 |
|
|
| 19,697,355 |
|
|
| 20,754,603 |
|
|
| 15,931,292 |
|
|
|
|
|
|
|
|
|
|
|
| ||||||||||
Stockholders' equity |
|
|
|
|
|
|
|
|
|
| ||||||||||
Common stock |
|
| 2,032 |
|
|
| 2,034 |
|
|
| 2,042 |
|
|
| 2,053 |
|
|
| 1,638 |
|
Capital surplus |
|
| 2,375,754 |
|
|
| 2,386,699 |
|
|
| 2,404,388 |
|
|
| 2,426,271 |
|
|
| 1,485,524 |
|
Retained earnings |
|
| 1,509,400 |
|
|
| 1,443,087 |
|
|
| 1,361,040 |
|
|
| 1,286,146 |
|
|
| 1,304,098 |
|
Accumulated other comprehensive loss |
|
| (256,301 | ) |
|
| (305,458 | ) |
|
| (307,455 | ) |
|
| (215,905 | ) |
|
| (104,557 | ) |
Total stockholders' equity |
|
| 3,630,885 |
|
|
| 3,526,362 |
|
|
| 3,460,015 |
|
|
| 3,498,565 |
|
|
| 2,686,703 |
|
Total liabilities and stockholders' equity |
| $ | 22,518,255 |
|
| $ | 22,883,588 |
|
| $ | 23,157,370 |
|
| $ | 24,253,168 |
|
| $ | 18,617,995 |
|
|
|
|
|
|
|
|
|
|
|
| ||||||||||
|
|
|
|
|
|
|
|
|
|
| ||||||||||
Home BancShares, Inc. | |||||||||||||||||||||||||
Consolidated Statements of Income | |||||||||||||||||||||||||
(Unaudited) | |||||||||||||||||||||||||
|
|
|
|
|
|
|
|
|
|
|
|
|
|
| |||||||||||
|
| Quarter Ended |
| Three Months Ended | |||||||||||||||||||||
(In thousands) |
| Mar. 31, 2023 |
| Dec. 31, 2022 |
| Sep. 30, 2022 |
| Jun. 30, 2022 |
| Mar. 31, 2022 |
| Mar. 31, 2023 |
| Mar. 31, 2022 | |||||||||||
Interest income: |
|
|
|
|
|
|
|
|
|
|
|
|
|
| |||||||||||
Loans |
| $ | 236,997 |
|
| $ | 221,280 |
| $ | 195,841 |
|
| $ | 181,779 |
|
| $ | 129,442 |
| $ | 236,997 |
|
| $ | 129,442 |
Investment securities |
|
|
|
|
|
|
|
|
|
|
|
|
|
| |||||||||||
Taxable |
|
| 35,288 |
|
|
| 33,639 |
|
| 28,273 |
|
|
| 20,941 |
|
|
| 9,080 |
|
| 35,288 |
|
|
| 9,080 |
Tax-exempt |
|
| 7,963 |
|
|
| 7,855 |
|
| 8,069 |
|
|
| 7,725 |
|
|
| 4,707 |
|
| 7,963 |
|
|
| 4,707 |
Deposits - other banks |
|
| 4,685 |
|
|
| 10,109 |
|
| 10,763 |
|
|
| 6,565 |
|
|
| 1,673 |
|
| 4,685 |
|
|
| 1,673 |
Federal funds sold |
|
| 6 |
|
|
| 12 |
|
| 9 |
|
|
| 3 |
|
|
| 1 |
|
| 6 |
|
|
| 1 |
Total interest income |
|
| 284,939 |
|
|
| 272,895 |
|
| 242,955 |
|
|
| 217,013 |
|
|
| 144,903 |
|
| 284,939 |
|
|
| 144,903 |
Interest expense: |
|
|
|
|
|
|
|
|
|
|
|
|
|
| |||||||||||
Interest on deposits |
|
| 59,162 |
|
|
| 47,019 |
|
| 23,347 |
|
|
| 10,729 |
|
|
| 4,894 |
|
| 59,162 |
|
|
| 4,894 |
Federal funds purchased |
|
| — |
|
|
| — |
|
| — |
|
|
| 2 |
|
|
| — |
|
| — |
|
|
| — |
FHLB borrowed funds |
|
| 6,190 |
|
|
| 5,388 |
|
| 1,917 |
|
|
| 1,896 |
|
|
| 1,875 |
|
| 6,190 |
|
|
| 1,875 |
Securities sold under agreements to repurchase |
|
| 868 |
|
|
| 701 |
|
| 434 |
|
|
| 187 |
|
|
| 108 |
|
| 868 |
|
|
| 108 |
Subordinated debentures |
|
| 4,124 |
|
|
| 4,121 |
|
| 4,153 |
|
|
| 5,441 |
|
|
| 6,878 |
|
| 4,124 |
|
|
| 6,878 |
Total interest expense |
|
| 70,344 |
|
|
| 57,229 |
|
| 29,851 |
|
|
| 18,255 |
|
|
| 13,755 |
|
| 70,344 |
|
|
| 13,755 |
Net interest income |
|
| 214,595 |
|
|
| 215,666 |
|
| 213,104 |
|
|
| 198,758 |
|
|
| 131,148 |
|
| 214,595 |
|
|
| 131,148 |
Provision for credit losses on loans |
|
| 1,200 |
|
|
| 5,000 |
|
| — |
|
|
| 45,170 |
|
|
| — |
|
| 1,200 |
|
|
| — |
Provision for credit losses on unfunded commitments |
|
| — |
|
|
| — |
|
| — |
|
|
| 11,410 |
|
|
| — |
|
| — |
|
|
| — |
Provision for credit losses on investment securities |
|
| — |
|
|
| — |
|
| — |
|
|
| 2,005 |
|
|
| — |
|
| — |
|
|
| — |
Total credit loss expense |
|
| 1,200 |
|
|
| 5,000 |
|
| — |
|
|
| 58,585 |
|
|
| — |
|
| 1,200 |
|
|
| — |
Net interest income after credit loss expense |
|
| 213,395 |
|
|
| 210,666 |
|
| 213,104 |
|
|
| 140,173 |
|
|
| 131,148 |
|
| 213,395 |
|
|
| 131,148 |
Non-interest income: |
|
|
|
|
|
|
|
|
|
|
|
|
|
| |||||||||||
Service charges on deposit accounts |
|
| 9,842 |
|
|
| 10,134 |
|
| 10,756 |
|
|
| 10,084 |
|
|
| 6,140 |
|
| 9,842 |
|
|
| 6,140 |
Other service charges and fees |
|
| 11,875 |
|
|
| 10,363 |
|
| 13,951 |
|
|
| 12,541 |
|
|
| 7,733 |
|
| 11,875 |
|
|
| 7,733 |
Trust fees |
|
| 4,864 |
|
|
| 3,981 |
|
| 3,980 |
|
|
| 4,320 |
|
|
| 574 |
|
| 4,864 |
|
|
| 574 |
Mortgage lending income |
|
| 2,571 |
|
|
| 3,566 |
|
| 4,179 |
|
|
| 5,996 |
|
|
| 3,916 |
|
| 2,571 |
|
|
| 3,916 |
Insurance commissions |
|
| 526 |
|
|
| 453 |
|
| 601 |
|
|
| 658 |
|
|
| 480 |
|
| 526 |
|
|
| 480 |
Increase in cash value of life insurance |
|
| 1,104 |
|
|
| 1,079 |
|
| 1,089 |
|
|
| 1,140 |
|
|
| 492 |
|
| 1,104 |
|
|
| 492 |
Dividends from FHLB, FRB, FNBB & other |
|
| 2,794 |
|
|
| 2,814 |
|
| 1,741 |
|
|
| 3,945 |
|
|
| 698 |
|
| 2,794 |
|
|
| 698 |
Gain on SBA loans |
|
| 139 |
|
|
| 30 |
|
| 58 |
|
|
| — |
|
|
| 95 |
|
| 139 |
|
|
| 95 |
Gain (loss) on branches, equipment and other assets, net |
|
| 7 |
|
|
| 10 |
|
| (13 | ) |
|
| 2 |
|
|
| 16 |
|
| 7 |
|
|
| 16 |
Gain on OREO, net |
|
| — |
|
|
| 13 |
|
| — |
|
|
| 9 |
|
|
| 478 |
|
| — |
|
|
| 478 |
Fair value adjustment for marketable securities |
|
| (11,408 | ) |
|
| 1,032 |
|
| (2,628 | ) |
|
| (1,801 | ) |
|
| 2,125 |
|
| (11,408 | ) |
|
| 2,125 |
Other income |
|
| 11,850 |
|
|
| 23,185 |
|
| 9,487 |
|
|
| 7,687 |
|
|
| 7,922 |
|
| 11,850 |
|
|
| 7,922 |
Total non-interest income |
|
| 34,164 |
|
|
| 56,660 |
|
| 43,201 |
|
|
| 44,581 |
|
|
| 30,669 |
|
| 34,164 |
|
|
| 30,669 |
Non-interest expense: |
|
|
|
|
|
|
|
|
|
|
|
|
|
| |||||||||||
Salaries and employee benefits |
|
| 64,490 |
|
|
| 64,249 |
|
| 65,290 |
|
|
| 65,795 |
|
|
| 43,551 |
|
| 64,490 |
|
|
| 43,551 |
Occupancy and equipment |
|
| 14,952 |
|
|
| 14,884 |
|
| 15,133 |
|
|
| 14,256 |
|
|
| 9,144 |
|
| 14,952 |
|
|
| 9,144 |
Data processing expense |
|
| 8,968 |
|
|
| 9,062 |
|
| 8,747 |
|
|
| 10,094 |
|
|
| 7,039 |
|
| 8,968 |
|
|
| 7,039 |
Merger and acquisition expenses |
|
| — |
|
|
| — |
|
| — |
|
|
| 48,731 |
|
|
| 863 |
|
| — |
|
|
| 863 |
Other operating expenses |
|
| 26,234 |
|
|
| 30,708 |
|
| 25,176 |
|
|
| 26,606 |
|
|
| 16,299 |
|
| 26,234 |
|
|
| 16,299 |
Total non-interest expense |
|
| 114,644 |
|
|
| 118,903 |
|
| 114,346 |
|
|
| 165,482 |
|
|
| 76,896 |
|
| 114,644 |
|
|
| 76,896 |
Income before income taxes |
|
| 132,915 |
|
|
| 148,423 |
|
| 141,959 |
|
|
| 19,272 |
|
|
| 84,921 |
|
| 132,915 |
|
|
| 84,921 |
Income tax expense |
|
| 29,953 |
|
|
| 32,736 |
|
| 33,254 |
|
|
| 3,294 |
|
|
| 20,029 |
|
| 29,953 |
|
|
| 20,029 |
Net income |
| $ | 102,962 |
|
| $ | 115,687 |
| $ | 108,705 |
|
| $ | 15,978 |
|
| $ | 64,892 |
| $ | 102,962 |
|
| $ | 64,892 |
|
|
|
|
|
|
|
|
|
|
|
|
|
|
| |||||||||||
| ||||||||||||||||||||||||||||
Home BancShares, Inc. | ||||||||||||||||||||||||||||
Selected Financial Information | ||||||||||||||||||||||||||||
(Unaudited) | ||||||||||||||||||||||||||||
|
|
|
|
|
|
|
|
|
|
|
|
|
|
| ||||||||||||||
|
| Quarter Ended |
| Three Months Ended | ||||||||||||||||||||||||
(Dollars and shares in thousands, except per share data) |
| Mar. 31, 2023 |
| Dec. 31, 2022 |
| Sep. 30, 2022 |
| Jun. 30, 2022 |
| Mar. 31, 2022 |
| Mar. 31, 2023 |
| Mar. 31, 2022 | ||||||||||||||
PER SHARE DATA |
|
|
|
|
|
|
|
|
|
|
|
|
|
| ||||||||||||||
Diluted earnings per common share |
| $ | 0.51 |
|
| $ | 0.57 |
|
| $ | 0.53 |
|
| $ | 0.08 |
|
| $ | 0.40 |
|
| $ | 0.51 |
|
| $ | 0.40 |
|
Diluted earnings per common share, as adjusted (non-GAAP)(1) |
|
| 0.54 |
|
|
| 0.53 |
|
|
| 0.54 |
|
|
| 0.47 |
|
|
| 0.37 |
|
|
| 0.54 |
|
|
| 0.37 |
|
Basic earnings per common share |
|
| 0.51 |
|
|
| 0.57 |
|
|
| 0.53 |
|
|
| 0.08 |
|
|
| 0.40 |
|
|
| 0.51 |
|
|
| 0.40 |
|
Dividends per share - common |
|
| 0.180 |
|
|
| 0.165 |
|
|
| 0.165 |
|
|
| 0.165 |
|
|
| 0.165 |
|
|
| 0.18 |
|
|
| 0.165 |
|
Book value per common share |
|
| 17.87 |
|
|
| 17.33 |
|
|
| 16.94 |
|
|
| 17.04 |
|
|
| 16.41 |
|
|
| 17.87 |
|
|
| 16.41 |
|
Tangible book value per common share (non-GAAP)(1) |
|
| 10.71 |
|
|
| 10.17 |
|
|
| 9.82 |
|
|
| 9.92 |
|
|
| 10.32 |
|
|
| 10.71 |
|
|
| 10.32 |
|
|
|
|
|
|
|
|
|
|
|
|
|
|
|
| ||||||||||||||
STOCK INFORMATION |
|
|
|
|
|
|
|
|
|
|
|
|
|
| ||||||||||||||
Average common shares outstanding |
|
| 203,456 |
|
|
| 203,924 |
|
|
| 204,829 |
|
|
| 205,683 |
|
|
| 163,787 |
|
|
| 203,456 |
|
|
| 163,787 |
|
Average diluted shares outstanding |
|
| 203,625 |
|
|
| 204,179 |
|
|
| 205,135 |
|
|
| 206,015 |
|
|
| 164,196 |
|
|
| 203,625 |
|
|
| 164,196 |
|
End of period common shares outstanding |
|
| 203,168 |
|
|
| 203,434 |
|
|
| 204,219 |
|
|
| 205,291 |
|
|
| 163,758 |
|
|
| 203,168 |
|
|
| 163,758 |
|
|
|
|
|
|
|
|
|
|
|
|
|
|
|
| ||||||||||||||
ANNUALIZED PERFORMANCE METRICS |
|
|
|
|
|
|
|
|
|
|
|
|
|
| ||||||||||||||
Return on average assets (ROA) |
|
| 1.84 | % |
|
| 1.98 | % |
|
| 1.81 | % |
|
| 0.26 | % |
|
| 1.43 | % |
|
| 1.84 | % |
|
| 1.43 | % |
Return on average assets, as adjusted: (ROA, as adjusted) (non-GAAP)(1) |
|
| 1.95 | % |
|
| 1.84 | % |
|
| 1.83 | % |
|
| 1.57 | % |
|
| 1.36 | % |
|
| 1.95 | % |
|
| 1.36 | % |
Return on average assets excluding intangible amortization (non-GAAP)(1) |
|
| 2.00 | % |
|
| 2.15 | % |
|
| 1.97 | % |
|
| 0.31 | % |
|
| 1.54 | % |
|
| 2.00 | % |
|
| 1.54 | % |
Return on average assets, as adjusted, excluding intangible amortization (non-GAAP)(1) |
|
| 2.12 | % |
|
| 2.00 | % |
|
| 1.99 | % |
|
| 1.70 | % |
|
| 1.46 | % |
|
| 2.12 | % |
|
| 1.46 | % |
Return on average common equity (ROE) |
|
| 11.70 | % |
|
| 13.29 | % |
|
| 12.25 | % |
|
| 1.78 | % |
|
| 9.58 | % |
|
| 11.70 | % |
|
| 9.58 | % |
Return on average common equity, as adjusted: (ROE, as adjusted) (non-GAAP)(1) |
|
| 12.38 | % |
|
| 12.35 | % |
|
| 12.39 | % |
|
| 10.83 | % |
|
| 9.09 | % |
|
| 12.38 | % |
|
| 9.09 | % |
Return on average tangible common equity (ROTCE) (non-GAAP)(1) |
|
| 19.75 | % |
|
| 22.96 | % |
|
| 20.93 | % |
|
| 2.96 | % |
|
| 15.03 | % |
|
| 19.75 | % |
|
| 15.03 | % |
Return on average tangible common equity, as adjusted: (ROTCE, as adjusted) (non-GAAP)(1) |
|
| 20.90 | % |
|
| 21.33 | % |
|
| 21.16 | % |
|
| 17.94 | % |
|
| 14.26 | % |
|
| 20.90 | % |
|
| 14.26 | % |
Return on average tangible common equity excluding intangible amortization (non-GAAP)(1) |
|
| 20.11 | % |
|
| 23.33 | % |
|
| 21.29 | % |
|
| 3.30 | % |
|
| 15.28 | % |
|
| 20.11 | % |
|
| 15.28 | % |
Return on average tangible common equity, as adjusted, excluding intangible amortization (non-GAAP)(1) |
|
| 21.26 | % |
|
| 21.70 | % |
|
| 21.52 | % |
|
| 18.29 | % |
|
| 14.50 | % |
|
| 21.26 | % |
|
| 14.50 | % |
|
|
|
|
|
|
|
|
|
|
|
|
|
|
| ||||||||||||||
(1) Calculation of this metric and the reconciliation to GAAP are included in the schedules accompanying this release. | ||||||||||||||||||||||||||||
|
|
|
|
|
|
|
|
|
|
|
|
|
|
| ||||||||||||||
Home BancShares, Inc. | ||||||||||||||||||||||||||||
Selected Financial Information | ||||||||||||||||||||||||||||
(Unaudited) | ||||||||||||||||||||||||||||
|
|
|
|
|
|
|
|
|
|
|
|
|
|
| ||||||||||||||
|
| Quarter Ended |
| Three Months Ended | ||||||||||||||||||||||||
(Dollars in thousands) |
| Mar. 31, 2023 |
| Dec. 31, 2022 |
| Sep. 30, 2022 |
| Jun. 30, 2022 |
| Mar. 31, 2022 |
| Mar. 31, 2023 |
| Mar. 31, 2022 | ||||||||||||||
Efficiency ratio |
|
| 44.80 | % |
|
| 42.44 | % |
|
| 43.24 | % |
|
| 66.31 | % |
|
| 46.15 | % |
|
| 44.80 | % |
|
| 46.15 | % |
Efficiency ratio, as adjusted (non-GAAP)(1) |
|
| 43.42 | % |
|
| 43.07 | % |
|
| 42.97 | % |
|
| 46.02 | % |
|
| 47.33 | % |
|
| 43.42 | % |
|
| 47.33 | % |
Net interest margin - FTE (NIM) |
|
| 4.37 | % |
|
| 4.21 | % |
|
| 4.05 | % |
|
| 3.64 | % |
|
| 3.21 | % |
|
| 4.37 | % |
|
| 3.21 | % |
Fully taxable equivalent adjustment |
| $ | 1,628 |
|
| $ | 2,017 |
|
| $ | 2,437 |
|
| $ | 2,471 |
|
| $ | 1,738 |
|
| $ | 1,628 |
|
| $ | 1,738 |
|
Total revenue (net) |
|
| 248,759 |
|
|
| 272,326 |
|
|
| 256,305 |
|
|
| 243,339 |
|
|
| 161,817 |
|
|
| 248,759 |
|
|
| 161,817 |
|
Pre-tax, pre-provision, net income (PPNR) (non-GAAP)(1) |
|
| 134,115 |
|
|
| 153,423 |
|
|
| 141,959 |
|
|
| 77,857 |
|
|
| 84,921 |
|
|
| 134,115 |
|
|
| 84,921 |
|
PPNR, as adjusted (non-GAAP)(1) |
|
| 142,062 |
|
|
| 142,567 |
|
|
| 143,522 |
|
|
| 126,683 |
|
|
| 80,371 |
|
|
| 142,062 |
|
|
| 80,371 |
|
Pre-tax net income to total revenue (net) |
|
| 53.43 | % |
|
| 54.50 | % |
|
| 55.39 | % |
|
| 7.92 | % |
|
| 52.48 | % |
|
| 53.43 | % |
|
| 52.48 | % |
Pre-tax net income, as adjusted, to total revenue (net) (non-GAAP)(1) |
|
| 56.63 | % |
|
| 50.52 | % |
|
| 56.00 | % |
|
| 52.06 | % |
|
| 49.67 | % |
|
| 56.63 | % |
|
| 49.67 | % |
P5NR(Pre-tax, pre-provision, profit percentage) (PPNR to total revenue (net)) (non-GAAP)(1) |
|
| 53.91 | % |
|
| 56.34 | % |
|
| 55.39 | % |
|
| 32.00 | % |
|
| 52.48 | % |
|
| 53.91 | % |
|
| 52.48 | % |
P5NR, as adjusted (non-GAAP)(1) |
|
| 57.11 | % |
|
| 52.35 | % |
|
| 56.00 | % |
|
| 52.06 | % |
|
| 49.67 | % |
|
| 57.11 | % |
|
| 49.67 | % |
Total purchase accounting accretion |
| $ | 3,172 |
|
| $ | 3,497 |
|
| $ | 4,578 |
|
| $ | 5,177 |
|
| $ | 3,089 |
|
| $ | 3,172 |
|
| $ | 3,089 |
|
Average purchase accounting loan discounts |
|
| 35,482 |
|
|
| 38,552 |
|
|
| 42,050 |
|
|
| 46,258 |
|
|
| 25,359 |
|
|
| 35,482 |
|
|
| 25,359 |
|
|
|
|
|
|
|
|
|
|
|
|
|
|
|
| ||||||||||||||
OTHER OPERATING EXPENSES |
|
|
|
|
|
|
|
|
|
|
|
|
|
| ||||||||||||||
|
|
|
|
|
|
|
|
|
|
|
|
|
|
| ||||||||||||||
Hurricane expense |
| $ | — |
|
| $ | 176 |
|
| $ | — |
|
| $ | — |
|
| $ | — |
|
| $ | — |
|
| $ | — |
|
Advertising |
|
| 2,231 |
|
|
| 2,567 |
|
|
| 2,024 |
|
|
| 2,117 |
|
|
| 1,266 |
|
|
| 2,231 |
|
|
| 1,266 |
|
Amortization of intangibles |
|
| 2,477 |
|
|
| 2,478 |
|
|
| 2,477 |
|
|
| 2,477 |
|
|
| 1,421 |
|
|
| 2,477 |
|
|
| 1,421 |
|
Electronic banking expense |
|
| 3,330 |
|
|
| 3,914 |
|
|
| 3,828 |
|
|
| 3,352 |
|
|
| 2,538 |
|
|
| 3,330 |
|
|
| 2,538 |
|
Directors' fees |
|
| 460 |
|
|
| 358 |
|
|
| 354 |
|
|
| 375 |
|
|
| 404 |
|
|
| 460 |
|
|
| 404 |
|
Due from bank service charges |
|
| 273 |
|
|
| 273 |
|
|
| 316 |
|
|
| 396 |
|
|
| 270 |
|
|
| 273 |
|
|
| 270 |
|
FDIC and state assessment |
|
| 3,500 |
|
|
| 2,224 |
|
|
| 2,146 |
|
|
| 2,390 |
|
|
| 1,668 |
|
|
| 3,500 |
|
|
| 1,668 |
|
Insurance |
|
| 889 |
|
|
| 1,003 |
|
|
| 959 |
|
|
| 973 |
|
|
| 770 |
|
|
| 889 |
|
|
| 770 |
|
Legal and accounting |
|
| 1,088 |
|
|
| 5,962 |
|
|
| 1,581 |
|
|
| 1,061 |
|
|
| 797 |
|
|
| 1,088 |
|
|
| 797 |
|
Other professional fees |
|
| 2,284 |
|
|
| 2,552 |
|
|
| 2,466 |
|
|
| 2,254 |
|
|
| 1,609 |
|
|
| 2,284 |
|
|
| 1,609 |
|
Operating supplies |
|
| 738 |
|
|
| 690 |
|
|
| 681 |
|
|
| 995 |
|
|
| 754 |
|
|
| 738 |
|
|
| 754 |
|
Postage |
|
| 501 |
|
|
| 602 |
|
|
| 614 |
|
|
| 556 |
|
|
| 306 |
|
|
| 501 |
|
|
| 306 |
|
Telephone |
|
| 528 |
|
|
| 576 |
|
|
| 593 |
|
|
| 384 |
|
|
| 337 |
|
|
| 528 |
|
|
| 337 |
|
Other expense |
|
| 7,935 |
|
|
| 7,333 |
|
|
| 7,137 |
|
|
| 9,276 |
|
|
| 4,159 |
|
|
| 7,935 |
|
|
| 4,159 |
|
Total other operating expenses |
| $ | 26,234 |
|
| $ | 30,708 |
|
| $ | 25,176 |
|
| $ | 26,606 |
|
| $ | 16,299 |
|
| $ | 26,234 |
|
| $ | 16,299 |
|
|
|
|
|
|
|
|
|
|
|
|
|
|
|
| ||||||||||||||
(1) Calculation of this metric and the reconciliation to GAAP are included in the schedules accompanying this release. | ||||||||||||||||||||||||||||
|
|
|
|
|
|
|
|
|
|
|
|
|
|
| ||||||||||||||
| ||||||||||||||||||||
Home BancShares, Inc. | ||||||||||||||||||||
Selected Financial Information | ||||||||||||||||||||
(Unaudited) | ||||||||||||||||||||
|
|
|
|
|
|
|
|
|
|
| ||||||||||
(Dollars in thousands) |
| Mar. 31, 2023 |
| Dec. 31, 2022 |
| Sep. 30, 2022 |
| Jun. 30, 2022 |
| Mar. 31, 2022 | ||||||||||
BALANCE SHEET RATIOS |
|
|
|
|
|
|
|
|
|
| ||||||||||
Total loans to total deposits |
|
| 82.47 | % |
|
| 80.33 | % |
|
| 74.58 | % |
|
| 71.11 | % |
|
| 68.94 | % |
Common equity to assets |
|
| 16.12 | % |
|
| 15.41 | % |
|
| 14.94 | % |
|
| 14.43 | % |
|
| 14.43 | % |
Tangible common equity to tangible assets (non-GAAP)(1) |
|
| 10.33 | % |
|
| 9.66 | % |
|
| 9.24 | % |
|
| 8.94 | % |
|
| 9.59 | % |
LOANS RECEIVABLE |
|
|
|
|
|
|
|
|
|
| ||||||||||
Real estate |
|
|
|
|
|
|
|
|
|
| ||||||||||
Commercial real estate loans |
|
|
|
|
|
|
|
|
|
| ||||||||||
Non-farm/non-residential |
| $ | 5,524,125 |
|
| $ | 5,632,063 |
|
| $ | 5,156,438 |
|
| $ | 5,092,539 |
|
| $ | 3,810,383 |
|
Construction/land development |
|
| 2,160,514 |
|
|
| 2,135,266 |
|
|
| 2,232,906 |
|
|
| 2,595,384 |
|
|
| 1,856,096 |
|
Agricultural |
|
| 342,814 |
|
|
| 346,811 |
|
|
| 330,748 |
|
|
| 329,106 |
|
|
| 142,920 |
|
Residential real estate loans |
|
|
|
|
|
|
|
|
|
| ||||||||||
Residential 1-4 family |
|
| 1,748,231 |
|
|
| 1,748,551 |
|
|
| 1,704,850 |
|
|
| 1,708,221 |
|
|
| 1,223,890 |
|
Multifamily residential |
|
| 637,633 |
|
|
| 578,052 |
|
|
| 525,110 |
|
|
| 389,633 |
|
|
| 248,650 |
|
Total real estate |
|
| 10,413,317 |
|
|
| 10,440,743 |
|
|
| 9,950,052 |
|
|
| 10,114,883 |
|
|
| 7,281,939 |
|
Consumer |
|
| 1,173,325 |
|
|
| 1,149,896 |
|
|
| 1,120,250 |
|
|
| 1,106,343 |
|
|
| 1,059,342 |
|
Commercial and industrial |
|
| 2,368,428 |
|
|
| 2,349,263 |
|
|
| 2,268,750 |
|
|
| 2,187,771 |
|
|
| 1,510,205 |
|
Agricultural |
|
| 250,851 |
|
|
| 285,235 |
|
|
| 313,693 |
|
|
| 324,630 |
|
|
| 48,095 |
|
Other |
|
| 180,713 |
|
|
| 184,343 |
|
|
| 176,566 |
|
|
| 190,246 |
|
|
| 153,133 |
|
Loans receivable |
| $ | 14,386,634 |
|
| $ | 14,409,480 |
|
| $ | 13,829,311 |
|
| $ | 13,923,873 |
|
| $ | 10,052,714 |
|
ALLOWANCE FOR CREDIT LOSSES |
|
|
|
|
|
|
|
|
|
| ||||||||||
Balance, beginning of period |
| $ | 289,669 |
|
| $ | 289,203 |
|
| $ | 294,267 |
|
| $ | 234,768 |
|
| $ | 236,714 |
|
Allowance for credit losses on PCD loans - Happy acquisition |
|
| — |
|
|
| — |
|
|
| — |
|
|
| 16,816 |
|
|
| — |
|
Loans charged off |
|
| 4,288 |
|
|
| 5,379 |
|
|
| 6,313 |
|
|
| 3,265 |
|
|
| 2,310 |
|
Recoveries of loans previously charged off |
|
| 588 |
|
|
| 845 |
|
|
| 1,249 |
|
|
| 778 |
|
|
| 364 |
|
Net loans charged off |
|
| 3,700 |
|
|
| 4,534 |
|
|
| 5,064 |
|
|
| 2,487 |
|
|
| 1,946 |
|
Provision for credit losses - Happy acquisition |
|
| — |
|
|
| — |
|
|
| — |
|
|
| 45,170 |
|
|
| — |
|
Provision for credit losses - loans |
|
| 1,200 |
|
|
| 5,000 |
|
|
| — |
|
|
| — |
|
|
| — |
|
Balance, end of period |
| $ | 287,169 |
|
| $ | 289,669 |
|
| $ | 289,203 |
|
| $ | 294,267 |
|
| $ | 234,768 |
|
Net charge-offs to average total loans |
|
| 0.10 | % |
|
| 0.13 | % |
|
| 0.15 | % |
|
| 0.07 | % |
|
| 0.08 | % |
Allowance for credit losses to total loans |
|
| 2.00 | % |
|
| 2.01 | % |
|
| 2.09 | % |
|
| 2.11 | % |
|
| 2.34 | % |
NON-PERFORMING ASSETS |
|
|
|
|
|
|
|
|
|
| ||||||||||
Non-performing loans |
|
|
|
|
|
|
|
|
|
| ||||||||||
Non-accrual loans |
| $ | 65,401 |
|
| $ | 51,011 |
|
| $ | 56,796 |
|
| $ | 44,170 |
|
| $ | 44,629 |
|
Loans past due 90 days or more |
|
| 8,567 |
|
|
| 9,845 |
|
|
| 4,898 |
|
|
| 16,432 |
|
|
| 46 |
|
Total non-performing loans |
|
| 73,968 |
|
|
| 60,856 |
|
|
| 61,694 |
|
|
| 60,602 |
|
|
| 44,675 |
|
Other non-performing assets |
|
|
|
|
|
|
|
|
|
| ||||||||||
Foreclosed assets held for sale, net |
|
| 425 |
|
|
| 546 |
|
|
| 365 |
|
|
| 373 |
|
|
| 1,144 |
|
Other non-performing assets |
|
| 74 |
|
|
| 74 |
|
|
| 104 |
|
|
| 104 |
|
|
| — |
|
Total other non-performing assets |
|
| 499 |
|
|
| 620 |
|
|
| 469 |
|
|
| 477 |
|
|
| 1,144 |
|
Total non-performing assets |
| $ | 74,467 |
|
| $ | 61,476 |
|
| $ | 62,163 |
|
| $ | 61,079 |
|
| $ | 45,819 |
|
|
|
|
|
|
|
|
|
|
|
| ||||||||||
Allowance for credit losses for loans to non-performing loans |
|
| 388.23 | % |
|
| 475.99 | % |
|
| 468.77 | % |
|
| 485.57 | % |
|
| 525.50 | % |
Non-performing loans to total loans |
|
| 0.51 | % |
|
| 0.42 | % |
|
| 0.45 | % |
|
| 0.44 | % |
|
| 0.44 | % |
Non-performing assets to total assets |
|
| 0.33 | % |
|
| 0.27 | % |
|
| 0.27 | % |
|
| 0.25 | % |
|
| 0.25 | % |
|
|
|
|
|
|
|
|
|
|
| ||||||||||
(1) Calculation of this metric and the reconciliation to GAAP are included in the schedules accompanying this release. | ||||||||||||||||||||
|
|
|
|
|
|
|
|
|
|
| ||||||||||
| ||||||||||||||||||
Home BancShares, Inc. | ||||||||||||||||||
Consolidated Net Interest Margin | ||||||||||||||||||
(Unaudited) | ||||||||||||||||||
|
|
|
|
|
|
|
|
|
|
|
|
| ||||||
|
| Three Months Ended | ||||||||||||||||
|
| March 31, 2023 |
| December 31, 2022 | ||||||||||||||
(Dollars in thousands) |
| Average |
| Income/ |
| Yield/ |
| Average |
| Income/ |
| Yield/ | ||||||
ASSETS |
|
|
|
|
|
|
|
|
|
|
|
| ||||||
Earning assets |
|
|
|
|
|
|
|
|
|
|
|
| ||||||
Interest-bearing balances due from banks |
| $ | 426,051 |
| $ | 4,685 |
| 4.46 | % |
| $ | 1,094,144 |
| $ | 10,109 |
| 3.67 | % |
Federal funds sold |
|
| 474 |
|
| 6 |
| 5.13 | % |
|
| 1,300 |
|
| 12 |
| 3.66 | % |
Investment securities - taxable |
|
| 3,867,737 |
|
| 35,288 |
| 3.70 | % |
|
| 4,002,678 |
|
| 33,639 |
| 3.33 | % |
Investment securities - non-taxable - FTE |
|
| 1,289,564 |
|
| 9,482 |
| 2.98 | % |
|
| 1,294,096 |
|
| 9,653 |
| 2.96 | % |
Loans receivable - FTE |
|
| 14,474,072 |
|
| 237,106 |
| 6.64 | % |
|
| 14,109,329 |
|
| 221,499 |
| 6.23 | % |
Total interest-earning assets |
|
| 20,057,898 |
|
| 286,567 |
| 5.79 | % |
|
| 20,501,547 |
|
| 274,912 |
| 5.32 | % |
Non-earning assets |
|
| 2,637,957 |
|
|
|
|
|
| 2,685,458 |
|
|
|
| ||||
Total assets |
| $ | 22,695,855 |
|
|
|
|
| $ | 23,187,005 |
|
|
|
| ||||
|
|
|
|
|
|
|
|
|
|
|
|
| ||||||
LIABILITIES AND SHAREHOLDERS' EQUITY |
|
|
|
|
|
|
|
|
|
|
|
| ||||||
Liabilities |
|
|
|
|
|
|
|
|
|
|
|
| ||||||
Interest-bearing liabilities |
|
|
|
|
|
|
|
|
|
|
|
| ||||||
Savings and interest-bearing transaction accounts |
| $ | 11,579,329 |
| $ | 54,857 |
| 1.92 | % |
| $ | 11,818,158 |
| $ | 45,029 |
| 1.51 | % |
Time deposits |
|
| 1,072,094 |
|
| 4,305 |
| 1.63 | % |
|
| 1,027,765 |
|
| 1,990 |
| 0.77 | % |
Total interest-bearing deposits |
|
| 12,651,423 |
|
| 59,162 |
| 1.90 | % |
|
| 12,845,923 |
|
| 47,019 |
| 1.45 | % |
Federal funds purchased |
|
| — |
|
| — |
| — | % |
|
| — |
|
| — |
| — | % |
Securities sold under agreement to repurchase |
|
| 134,934 |
|
| 868 |
| 2.61 | % |
|
| 128,798 |
|
| 701 |
| 2.16 | % |
FHLB borrowed funds |
|
| 651,111 |
|
| 6,190 |
| 3.86 | % |
|
| 692,935 |
|
| 5,388 |
| 3.08 | % |
Subordinated debentures |
|
| 440,346 |
|
| 4,124 |
| 3.80 | % |
|
| 440,492 |
|
| 4,121 |
| 3.71 | % |
Total interest-bearing liabilities |
|
| 13,877,814 |
|
| 70,344 |
| 2.06 | % |
|
| 14,108,148 |
|
| 57,229 |
| 1.61 | % |
Non-interest bearing liabilities |
|
|
|
|
|
|
|
|
|
|
|
| ||||||
Non-interest bearing deposits |
|
| 5,043,219 |
|
|
|
|
|
| 5,423,821 |
|
|
|
| ||||
Other liabilities |
|
| 205,230 |
|
|
|
|
|
| 201,031 |
|
|
|
| ||||
Total liabilities |
|
| 19,126,263 |
|
|
|
|
|
| 19,733,000 |
|
|
|
| ||||
Shareholders' equity |
|
| 3,569,592 |
|
|
|
|
|
| 3,454,005 |
|
|
|
| ||||
Total liabilities and shareholders' equity |
| $ | 22,695,855 |
|
|
|
|
| $ | 23,187,005 |
|
|
|
| ||||
Net interest spread |
|
|
|
|
| 3.73 | % |
|
|
|
|
| 3.71 | % | ||||
Net interest income and margin - FTE |
|
|
| $ | 216,223 |
| 4.37 | % |
|
|
| $ | 217,683 |
| 4.21 | % | ||
|
|
|
|
|
|
|
|
|
|
|
|
| ||||||
| ||||||||||||||||||
Home BancShares, Inc. | ||||||||||||||||||
Consolidated Net Interest Margin | ||||||||||||||||||
(Unaudited) | ||||||||||||||||||
|
|
|
|
|
|
|
|
|
|
|
|
| ||||||
|
| Three Months Ended | ||||||||||||||||
|
| March 31, 2023 |
| March 31, 2022 | ||||||||||||||
(Dollars in thousands) |
| Average |
| Income/ |
| Yield/ |
| Average |
| Income/ |
| Yield/ | ||||||
ASSETS |
|
|
|
|
|
|
|
|
|
|
|
| ||||||
Earning assets |
|
|
|
|
|
|
|
|
|
|
|
| ||||||
Interest-bearing balances due from banks |
| $ | 426,051 |
| $ | 4,685 |
| 4.46 | % |
| $ | 3,497,894 |
| $ | 1,673 |
| 0.19 | % |
Federal funds sold |
|
| 474 |
|
| 6 |
| 5.13 | % |
|
| 1,751 |
|
| 1 |
| 0.23 | % |
Investment securities - taxable |
|
| 3,867,737 |
|
| 35,288 |
| 3.70 | % |
|
| 2,486,401 |
|
| 9,080 |
| 1.48 | % |
Investment securities - non-taxable - FTE |
|
| 1,289,564 |
|
| 9,482 |
| 2.98 | % |
|
| 850,722 |
|
| 6,284 |
| 3.00 | % |
Loans receivable - FTE |
|
| 14,474,072 |
|
| 237,106 |
| 6.64 | % |
|
| 9,937,993 |
|
| 129,603 |
| 5.29 | % |
Total interest-earning assets |
|
| 20,057,898 |
|
| 286,567 |
| 5.79 | % |
|
| 16,774,761 |
|
| 146,641 |
| 3.55 | % |
Non-earning assets |
|
| 2,637,957 |
|
|
|
|
|
| 1,618,314 |
|
|
|
| ||||
Total assets |
| $ | 22,695,855 |
|
|
|
|
| $ | 18,393,075 |
|
|
|
| ||||
|
|
|
|
|
|
|
|
|
|
|
|
| ||||||
LIABILITIES AND SHAREHOLDERS' EQUITY |
|
|
|
|
|
|
|
|
|
|
|
| ||||||
Liabilities |
|
|
|
|
|
|
|
|
|
|
|
| ||||||
Interest-bearing liabilities |
|
|
|
|
|
|
|
|
|
|
|
| ||||||
Savings and interest-bearing transaction accounts |
| $ | 11,579,329 |
| $ | 54,857 |
| 1.92 | % |
| $ | 9,363,793 |
| $ | 3,873 |
| 0.17 | % |
Time deposits |
|
| 1,072,094 |
|
| 4,305 |
| 1.63 | % |
|
| 854,593 |
|
| 1,021 |
| 0.48 | % |
Total interest-bearing deposits |
|
| 12,651,423 |
|
| 59,162 |
| 1.90 | % |
|
| 10,218,386 |
|
| 4,894 |
| 0.19 | % |
Federal funds purchased |
|
| — |
|
| — |
| — | % |
|
| — |
|
| — |
| — | % |
Securities sold under agreement to repurchase |
|
| 134,934 |
|
| 868 |
| 2.61 | % |
|
| 137,565 |
|
| 108 |
| 0.32 | % |
FHLB borrowed funds |
|
| 651,111 |
|
| 6,190 |
| 3.86 | % |
|
| 400,000 |
|
| 1,875 |
| 1.90 | % |
Subordinated debentures |
|
| 440,346 |
|
| 4,124 |
| 3.80 | % |
|
| 611,888 |
|
| 6,878 |
| 4.56 | % |
Total interest-bearing liabilities |
|
| 13,877,814 |
|
| 70,344 |
| 2.06 | % |
|
| 11,367,839 |
|
| 13,755 |
| 0.49 | % |
Non-interest bearing liabilities |
|
|
|
|
|
|
|
|
|
|
|
| ||||||
Non-interest bearing deposits |
|
| 5,043,219 |
|
|
|
|
|
| 4,155,894 |
|
|
|
| ||||
Other liabilities |
|
| 205,230 |
|
|
|
|
|
| 121,362 |
|
|
|
| ||||
Total liabilities |
|
| 19,126,263 |
|
|
|
|
|
| 15,645,095 |
|
|
|
| ||||
Shareholders' equity |
|
| 3,569,592 |
|
|
|
|
|
| 2,747,980 |
|
|
|
| ||||
Total liabilities and shareholders' equity |
| $ | 22,695,855 |
|
|
|
|
| $ | 18,393,075 |
|
|
|
| ||||
Net interest spread |
|
|
|
|
| 3.73 | % |
|
|
|
|
| 3.06 | % | ||||
Net interest income and margin - FTE |
|
|
| $ | 216,223 |
| 4.37 | % |
|
|
| $ | 132,886 |
| 3.21 | % | ||
|
|
|
|
|
|
|
|
|
|
|
|
| ||||||
| ||||||||||||||||||||||||||||
Non-GAAP Reconciliations | ||||||||||||||||||||||||||||
(Unaudited) | ||||||||||||||||||||||||||||
|
|
|
|
|
|
|
|
|
|
|
|
|
|
| ||||||||||||||
|
| Quarter Ended |
| Three Months Ended | ||||||||||||||||||||||||
(Dollars and shares in thousands, except per share data) |
| Mar. 31, 2023 |
| Dec. 31, 2022 |
| Sep. 30, 2022 |
| Jun. 30, 2022 |
| Mar. 31, 2022 |
| Mar. 31, 2023 |
| Mar. 31, 2022 | ||||||||||||||
EARNINGS, AS ADJUSTED |
|
|
|
|
|
|
|
|
|
|
|
|
|
| ||||||||||||||
GAAP net income available to common shareholders (A) |
| $ | 102,962 |
|
| $ | 115,687 |
|
| $ | 108,705 |
|
| $ | 15,978 |
|
| $ | 64,892 |
|
| $ | 102,962 |
|
| $ | 64,892 |
|
Pre-tax adjustments |
|
|
|
|
|
|
|
|
|
|
|
|
|
| ||||||||||||||
Merger and acquisition expenses |
|
| — |
|
|
| — |
|
|
| — |
|
|
| 48,731 |
|
|
| 863 |
|
|
| — |
|
|
| 863 |
|
Initial provision for credit losses - acquisition |
|
| — |
|
|
| — |
|
|
| — |
|
|
| 58,585 |
|
|
| — |
|
|
| — |
|
|
| — |
|
Fair value adjustment for marketable securities |
|
| 11,408 |
|
|
| (1,032 | ) |
|
| 2,628 |
|
|
| 1,801 |
|
|
| (2,125 | ) |
|
| 11,408 |
|
|
| (2,125 | ) |
Special dividend from equity investment |
|
| — |
|
|
| — |
|
|
| — |
|
|
| (1,434 | ) |
|
| — |
|
|
| — |
|
|
| — |
|
TRUPS redemption fees |
|
| — |
|
|
| — |
|
|
| — |
|
|
| 2,081 |
|
|
| — |
|
|
| — |
|
|
| — |
|
Special lawsuit settlement, net of expense |
|
| — |
|
|
| (10,000 | ) |
|
| — |
|
|
| — |
|
|
| — |
|
|
| — |
|
|
| — |
|
Recoveries on historic losses |
|
| (3,461 | ) |
|
| — |
|
|
| (1,065 | ) |
|
| (2,353 | ) |
|
| (3,288 | ) |
|
| (3,461 | ) |
|
| (3,288 | ) |
Hurricane expense |
|
| — |
|
|
| 176 |
|
|
| — |
|
|
| — |
|
|
| — |
|
|
| — |
|
|
| — |
|
Total pre-tax adjustments |
|
| 7,947 |
|
|
| (10,856 | ) |
|
| 1,563 |
|
|
| 107,411 |
|
|
| (4,550 | ) |
|
| 7,947 |
|
|
| (4,550 | ) |
Tax-effect of adjustments |
|
| 1,961 |
|
|
| (2,679 | ) |
|
| 393 |
|
|
| 26,396 |
|
|
| (1,220 | ) |
|
| 1,961 |
|
|
| (1,220 | ) |
Total adjustments after-tax (B) |
|
| 5,986 |
|
|
| (8,177 | ) |
|
| 1,170 |
|
|
| 81,015 |
|
|
| (3,330 | ) |
|
| 5,986 |
|
|
| (3,330 | ) |
Earnings, as adjusted (C) |
| $ | 108,948 |
|
| $ | 107,510 |
|
| $ | 109,875 |
|
| $ | 96,993 |
|
| $ | 61,562 |
|
| $ | 108,948 |
|
| $ | 61,562 |
|
|
|
|
|
|
|
|
|
|
|
|
|
|
|
| ||||||||||||||
Average diluted shares outstanding (D) |
|
| 203,625 |
|
|
| 204,179 |
|
|
| 205,135 |
|
|
| 206,015 |
|
|
| 164,196 |
|
|
| 203,625 |
|
|
| 164,196 |
|
|
|
|
|
|
|
|
|
|
|
|
|
|
|
| ||||||||||||||
GAAP diluted earnings per share: (A/D) |
| $ | 0.51 |
|
| $ | 0.57 |
|
| $ | 0.53 |
|
| $ | 0.08 |
|
| $ | 0.40 |
|
| $ | 0.51 |
|
| $ | 0.40 |
|
Adjustments after-tax: (B/D) |
|
| 0.03 |
|
|
| (0.04 | ) |
|
| 0.01 |
|
|
| 0.39 |
|
|
| (0.03 | ) |
|
| 0.03 |
|
|
| (0.03 | ) |
Diluted earnings per common share, as adjusted: (C/D) |
| $ | 0.54 |
|
| $ | 0.53 |
|
| $ | 0.54 |
|
| $ | 0.47 |
|
| $ | 0.37 |
|
| $ | 0.54 |
|
| $ | 0.37 |
|
|
|
|
|
|
|
|
|
|
|
|
|
|
|
| ||||||||||||||
ANNUALIZED RETURN ON AVERAGE ASSETS |
|
|
|
|
|
|
|
|
|
|
|
|
|
| ||||||||||||||
|
|
|
|
|
|
|
|
|
|
|
|
|
|
| ||||||||||||||
Return on average assets: (A/E) |
|
| 1.84 | % |
|
| 1.98 | % |
|
| 1.81 | % |
|
| 0.26 | % |
|
| 1.43 | % |
|
| 1.84 | % |
|
| 1.43 | % |
Return on average assets, as adjusted: (ROA, as adjusted) ((A+D)/E) |
|
| 1.95 | % |
|
| 1.84 | % |
|
| 1.83 | % |
|
| 1.57 | % |
|
| 1.36 | % |
|
| 1.95 | % |
|
| 1.36 | % |
Return on average assets excluding intangible amortization: ((A+C)/(E-F)) |
|
| 2.00 | % |
|
| 2.15 | % |
|
| 1.97 | % |
|
| 0.31 | % |
|
| 1.54 | % |
|
| 2.00 | % |
|
| 1.54 | % |
Return on average assets, as adjusted, excluding intangible amortization: ((A+C+D)/(E-F)) |
|
| 2.12 | % |
|
| 2.00 | % |
|
| 1.99 | % |
|
| 1.70 | % |
|
| 1.46 | % |
|
| 2.12 | % |
|
| 1.46 | % |
|
|
|
|
|
|
|
|
|
|
|
|
|
|
| ||||||||||||||
GAAP net income available to common shareholders (A) |
| $ | 102,962 |
|
| $ | 115,687 |
|
| $ | 108,705 |
|
| $ | 15,978 |
|
| $ | 64,892 |
|
| $ | 102,962 |
|
| $ | 64,892 |
|
Amortization of intangibles (B) |
|
| 2,477 |
|
|
| 2,478 |
|
|
| 2,477 |
|
|
| 2,477 |
|
|
| 1,421 |
|
|
| 2,477 |
|
|
| 1,421 |
|
Amortization of intangibles after-tax (C) |
|
| 1,866 |
|
|
| 1,867 |
|
|
| 1,854 |
|
|
| 1,854 |
|
|
| 1,049 |
|
|
| 1,866 |
|
|
| 1,049 |
|
Adjustments after-tax (D) |
|
| 5,986 |
|
|
| (8,177 | ) |
|
| 1,170 |
|
|
| 81,015 |
|
|
| (3,330 | ) |
|
| 5,986 |
|
|
| (3,330 | ) |
Average assets (E) |
|
| 22,695,855 |
|
|
| 23,187,005 |
|
|
| 23,778,769 |
|
|
| 24,788,365 |
|
|
| 18,393,075 |
|
|
| 22,695,855 |
|
|
| 18,393,075 |
|
Average goodwill & core deposit intangible (F) |
|
| 1,455,423 |
|
|
| 1,454,639 |
|
|
| 1,459,034 |
|
|
| 1,423,466 |
|
|
| 997,338 |
|
|
| 1,455,423 |
|
|
| 997,338 |
|
|
|
|
|
|
|
|
|
|
|
|
|
|
|
| ||||||||||||||
Home BancShares, Inc. | ||||||||||||||||||||||||||||
Non-GAAP Reconciliations | ||||||||||||||||||||||||||||
(Unaudited) | ||||||||||||||||||||||||||||
|
|
|
|
|
|
|
|
|
|
|
|
|
|
| ||||||||||||||
|
| Quarter Ended |
| Three Months Ended | ||||||||||||||||||||||||
(Dollars in thousands) |
| Mar. 31, 2023 |
| Dec. 31, 2022 |
| Sep. 30, 2022 |
| Jun. 30, 2022 |
| Mar. 31, 2022 |
| Mar. 31, 2023 |
| Mar. 31, 2022 | ||||||||||||||
ANNUALIZED RETURN ON AVERAGE COMMON EQUITY |
|
|
|
|
|
|
|
|
|
|
|
|
|
| ||||||||||||||
Return on average common equity: (A/D) |
|
| 11.70 | % |
|
| 13.29 | % |
|
| 12.25 | % |
|
| 1.78 | % |
|
| 9.58 | % |
|
| 11.70 | % |
|
| 9.58 | % |
Return on average common equity, as adjusted: (ROE, as adjusted) ((A+C)/D) |
|
| 12.38 | % |
|
| 12.35 | % |
|
| 12.39 | % |
|
| 10.83 | % |
|
| 9.09 | % |
|
| 12.38 | % |
|
| 9.09 | % |
Return on average tangible common equity: (A/(D-E)) |
|
| 19.75 | % |
|
| 22.96 | % |
|
| 20.93 | % |
|
| 2.96 | % |
|
| 15.03 | % |
|
| 19.75 | % |
|
| 15.03 | % |
Return on average tangible common equity, as adjusted: (ROTCE, as adjusted) ((A+C)/(D-E)) |
|
| 20.90 | % |
|
| 21.33 | % |
|
| 21.16 | % |
|
| 17.94 | % |
|
| 14.26 | % |
|
| 20.90 | % |
|
| 14.26 | % |
Return on average tangible common equity excluding intangible amortization: (B/(D-E)) |
|
| 20.11 | % |
|
| 23.33 | % |
|
| 21.29 | % |
|
| 3.30 | % |
|
| 15.28 | % |
|
| 20.11 | % |
|
| 15.28 | % |
Return on average tangible common equity, as adjusted, excluding intangible amortization: ((B+C)/(D-E)) |
|
| 21.26 | % |
|
| 21.70 | % |
|
| 21.52 | % |
|
| 18.29 | % |
|
| 14.50 | % |
|
| 21.26 | % |
|
| 14.50 | % |
|
|
|
|
|
|
|
|
|
|
|
|
|
|
| ||||||||||||||
GAAP net income available to common shareholders (A) |
| $ | 102,962 |
|
| $ | 115,687 |
|
| $ | 108,705 |
|
| $ | 15,978 |
|
| $ | 64,892 |
|
| $ | 102,962 |
|
| $ | 64,892 |
|
Earnings excluding intangible amortization (B) |
|
| 104,828 |
|
|
| 117,554 |
|
|
| 110,559 |
|
|
| 17,832 |
|
|
| 65,941 |
|
|
| 104,828 |
|
|
| 65,941 |
|
Adjustments after-tax (C) |
|
| 5,986 |
|
|
| (8,177 | ) |
|
| 1,170 |
|
|
| 81,015 |
|
|
| (3,330 | ) |
|
| 5,986 |
|
|
| (3,330 | ) |
Average common equity (D) |
|
| 3,569,592 |
|
|
| 3,454,005 |
|
|
| 3,519,296 |
|
|
| 3,591,758 |
|
|
| 2,747,980 |
|
|
| 3,569,592 |
|
|
| 2,747,980 |
|
Average goodwill & core deposits intangible (E) |
|
| 1,455,423 |
|
|
| 1,454,639 |
|
|
| 1,459,034 |
|
|
| 1,423,466 |
|
|
| 997,338 |
|
|
| 1,455,423 |
|
|
| 997,338 |
|
|
|
|
|
|
|
|
|
|
|
|
|
|
|
| ||||||||||||||
EFFICIENCY RATIO & P5NR |
|
|
|
|
|
|
|
|
|
|
|
|
|
| ||||||||||||||
|
|
|
|
|
|
|
|
|
|
|
|
|
|
| ||||||||||||||
Efficiency ratio: ((D-H)/(B+C+E)) |
|
| 44.80 | % |
|
| 42.44 | % |
|
| 43.24 | % |
|
| 66.31 | % |
|
| 46.15 | % |
|
| 44.80 | % |
|
| 46.15 | % |
Efficiency ratio, as adjusted: ((D-H-J)/(B+C+E-I)) |
|
| 43.42 | % |
|
| 43.07 | % |
|
| 42.97 | % |
|
| 46.02 | % |
|
| 47.33 | % |
|
| 43.42 | % |
|
| 47.33 | % |
Pre-tax net income to total revenue (net) (A/(B+C)) |
|
| 53.43 | % |
|
| 54.50 | % |
|
| 55.39 | % |
|
| 7.92 | % |
|
| 52.48 | % |
|
| 53.43 | % |
|
| 52.48 | % |
Pre-tax net income, as adjusted, to total revenue (net) ((A+F)/(B+C)) |
|
| 56.63 | % |
|
| 50.52 | % |
|
| 56.00 | % |
|
| 52.06 | % |
|
| 49.67 | % |
|
| 56.63 | % |
|
| 49.67 | % |
Pre-tax, pre-provision, net income (PPNR) (B+C-D) |
| $ | 134,115 |
|
| $ | 153,423 |
|
| $ | 141,959 |
|
| $ | 77,857 |
|
| $ | 84,921 |
|
| $ | 134,115 |
|
| $ | 84,921 |
|
Pre-tax, pre-provision, net income, as adjusted (B+C-D+F-G) |
| $ | 142,062 |
|
| $ | 142,567 |
|
| $ | 143,522 |
|
| $ | 126,683 |
|
| $ | 80,371 |
|
| $ | 142,062 |
|
| $ | 80,371 |
|
P5NR (Pre-tax, pre-provision, profit percentage) PPNR to total revenue (net)) (B+C-D)/(B+C) |
|
| 53.91 | % |
|
| 56.34 | % |
|
| 55.39 | % |
|
| 32.00 | % |
|
| 52.48 | % |
|
| 53.91 | % |
|
| 52.48 | % |
P5NR, as adjusted (B+C-D+F-G)/(B+C) |
|
| 57.11 | % |
|
| 52.35 | % |
|
| 56.00 | % |
|
| 52.06 | % |
|
| 49.67 | % |
|
| 57.11 | % |
|
| 49.67 | % |
|
|
|
|
|
|
|
|
|
|
|
|
|
|
| ||||||||||||||
Pre-tax net income (A) |
| $ | 132,915 |
|
| $ | 148,423 |
|
| $ | 141,959 |
|
| $ | 19,272 |
|
| $ | 84,921 |
|
| $ | 132,915 |
|
| $ | 84,921 |
|
Net interest income (B) |
|
| 214,595 |
|
|
| 215,666 |
|
|
| 213,104 |
|
|
| 198,758 |
|
|
| 131,148 |
|
|
| 214,595 |
|
|
| 131,148 |
|
Non-interest income (C) |
|
| 34,164 |
|
|
| 56,660 |
|
|
| 43,201 |
|
|
| 44,581 |
|
|
| 30,669 |
|
|
| 34,164 |
|
|
| 30,669 |
|
Non-interest expense (D) |
|
| 114,644 |
|
|
| 118,903 |
|
|
| 114,346 |
|
|
| 165,482 |
|
|
| 76,896 |
|
|
| 114,644 |
|
|
| 76,896 |
|
Fully taxable equivalent adjustment (E) |
|
| 1,628 |
|
|
| 2,017 |
|
|
| 2,437 |
|
|
| 2,471 |
|
|
| 1,738 |
|
|
| 1,628 |
|
|
| 1,738 |
|
Total pre-tax adjustments (F) |
|
| 7,947 |
|
|
| (10,856 | ) |
|
| 1,563 |
|
|
| 107,411 |
|
|
| (4,550 | ) |
|
| 7,947 |
|
|
| (4,550 | ) |
Initial provision for credit losses - acquisition (G) |
|
| — |
|
|
| — |
|
|
| — |
|
|
| 58,585 |
|
|
| — |
|
|
| — |
|
|
| — |
|
Amortization of intangibles (H) |
|
| 2,477 |
|
|
| 2,478 |
|
|
| 2,477 |
|
|
| 2,477 |
|
|
| 1,421 |
|
|
| 2,477 |
|
|
| 1,421 |
|
|
|
|
|
|
|
|
|
|
|
|
|
|
|
| ||||||||||||||
Adjustments: |
|
|
|
|
|
|
|
|
|
|
|
|
|
| ||||||||||||||
Non-interest income: |
|
|
|
|
|
|
|
|
|
|
|
|
|
| ||||||||||||||
Fair value adjustment for marketable securities |
| $ | (11,408 | ) |
| $ | 1,032 |
|
| $ | (2,628 | ) |
| $ | (1,801 | ) |
| $ | 2,125 |
|
| $ | (11,408 | ) |
| $ | 2,125 |
|
Gain on OREO |
|
| — |
|
|
| 13 |
|
|
| — |
|
|
| 9 |
|
|
| 478 |
|
|
| — |
|
|
| 478 |
|
Gain (loss) on branches, equipment and other assets, net |
|
| 7 |
|
|
| 10 |
|
|
| (13 | ) |
|
| 2 |
|
|
| 16 |
|
|
| 7 |
|
|
| 16 |
|
Special dividend from equity investment |
|
| — |
|
|
| — |
|
|
| — |
|
|
| 1,434 |
|
|
| — |
|
|
| — |
|
|
| — |
|
Lawsuit settlement - special lawsuit |
|
| — |
|
|
| 15,000 |
|
|
| — |
|
|
| — |
|
|
| — |
|
|
| — |
|
|
| — |
|
Recoveries on historic losses |
|
| 3,461 |
|
|
| — |
|
|
| 1,065 |
|
|
| 2,353 |
|
|
| 3,288 |
|
|
| 3,461 |
|
|
| 3,288 |
|
Total non-interest income adjustments (I) |
| $ | (7,940 | ) |
| $ | 16,055 |
|
| $ | (1,576 | ) |
| $ | 1,997 |
|
| $ | 5,907 |
|
| $ | (7,940 | ) |
| $ | 5,907 |
|
|
|
|
|
|
|
|
|
|
|
|
|
|
|
| ||||||||||||||
Non-interest expense: |
|
|
|
|
|
|
|
|
|
|
|
|
|
| ||||||||||||||
Merger and acquisition expenses |
|
| — |
|
|
| — |
|
|
| — |
|
|
| 48,731 |
|
|
| 863 |
|
|
| — |
|
|
| 863 |
|
Hurricane expense |
|
| — |
|
|
| 176 |
|
|
| — |
|
|
| — |
|
|
| — |
|
|
| — |
|
|
| — |
|
Legal expense - special lawsuit |
|
| — |
|
|
| 5,000 |
|
|
| — |
|
|
| — |
|
|
| — |
|
|
| — |
|
|
| — |
|
TRUPS redemption fees |
|
| — |
|
|
| — |
|
|
| — |
|
|
| 2,081 |
|
|
| — |
|
|
| — |
|
|
| — |
|
Total non-interest expense adjustments (J) |
| $ | — |
|
| $ | 5,176 |
|
| $ | — |
|
| $ | 50,812 |
|
| $ | 863 |
|
| $ | — |
|
| $ | 863 |
|
|
|
|
|
|
|
|
|
|
|
|
|
|
|
| ||||||||||||||
|
|
|
|
|
|
|
|
|
|
|
|
|
|
| ||||||||||||||
| ||||||||||||||||||||
Home BancShares, Inc. | ||||||||||||||||||||
Non-GAAP Reconciliations | ||||||||||||||||||||
(Unaudited) | ||||||||||||||||||||
|
|
|
|
|
|
|
|
|
|
| ||||||||||
|
| Quarter Ended | ||||||||||||||||||
|
| Mar. 31, 2023 |
| Dec. 31, 2022 |
| Sep. 30, 2022 |
| Jun. 30, 2022 |
| Mar. 31, 2022 | ||||||||||
TANGIBLE BOOK VALUE PER COMMON SHARE |
|
|
|
|
|
|
|
|
|
| ||||||||||
Book value per common share: (A/B) |
| $ | 17.87 |
|
| $ | 17.33 |
|
| $ | 16.94 |
|
| $ | 17.04 |
|
| $ | 16.41 |
|
Tangible book value per common share: ((A-C-D)/B) |
|
| 10.71 |
|
|
| 10.17 |
|
|
| 9.82 |
|
|
| 9.92 |
|
|
| 10.32 |
|
|
|
|
|
|
|
|
|
|
|
| ||||||||||
Total stockholders' equity (A) |
| $ | 3,630,885 |
|
| $ | 3,526,362 |
|
| $ | 3,460,015 |
|
| $ | 3,498,565 |
|
| $ | 2,686,703 |
|
End of period common shares outstanding (B) |
|
| 203,168 |
|
|
| 203,434 |
|
|
| 204,219 |
|
|
| 205,291 |
|
|
| 163,758 |
|
Goodwill (C) |
|
| 1,398,253 |
|
|
| 1,398,253 |
|
|
| 1,394,353 |
|
|
| 1,398,400 |
|
|
| 973,025 |
|
Core deposit and other intangibles (D) |
|
| 55,978 |
|
|
| 58,455 |
|
|
| 60,932 |
|
|
| 63,410 |
|
|
| 23,624 |
|
|
|
|
|
|
|
|
|
|
|
| ||||||||||
TANGIBLE COMMON EQUITY TO TANGIBLE ASSETS |
|
|
|
|
|
|
|
|
|
| ||||||||||
Equity to assets: (B/A) |
|
| 16.12 | % |
|
| 15.41 | % |
|
| 14.94 | % |
|
| 14.43 | % |
|
| 14.43 | % |
Tangible common equity to tangible assets: ((B-C-D)/(A-C-D)) |
|
| 10.33 | % |
|
| 9.66 | % |
|
| 9.24 | % |
|
| 8.94 | % |
|
| 9.59 | % |
|
|
|
|
|
|
|
|
|
|
| ||||||||||
Total assets (A) |
| $ | 22,518,255 |
|
| $ | 22,883,588 |
|
| $ | 23,157,370 |
|
| $ | 24,253,168 |
|
| $ | 18,617,995 |
|
Total stockholders' equity (B) |
|
| 3,630,885 |
|
|
| 3,526,362 |
|
|
| 3,460,015 |
|
|
| 3,498,565 |
|
|
| 2,686,703 |
|
Goodwill (C) |
|
| 1,398,253 |
|
|
| 1,398,253 |
|
|
| 1,394,353 |
|
|
| 1,398,400 |
|
|
| 973,025 |
|
Core deposit and other intangibles (D) |
|
| 55,978 |
|
|
| 58,455 |
|
|
| 60,932 |
|
|
| 63,410 |
|
|
| 23,624 |
|
|
|
|
|
|
|
|
|
|
|
| ||||||||||
Photos accompanying this announcement are available at
https://www.globenewswire.com/NewsRoom/AttachmentNg/86c8a78c-9af1-4dba-a738-1fb994ca2bfb
https://www.globenewswire.com/NewsRoom/AttachmentNg/cdbfd6bb-6e7e-4a2b-9431-f2807c2d1414
https://www.globenewswire.com/NewsRoom/AttachmentNg/e4611681-223d-4b99-ad25-232e2356c6a9

