Is Huadian Power International Corporation Limited's (HKG:1071) High P/E Ratio A Problem For Investors?

Want to participate in a research study? Help shape the future of investing tools and earn a $60 gift card!
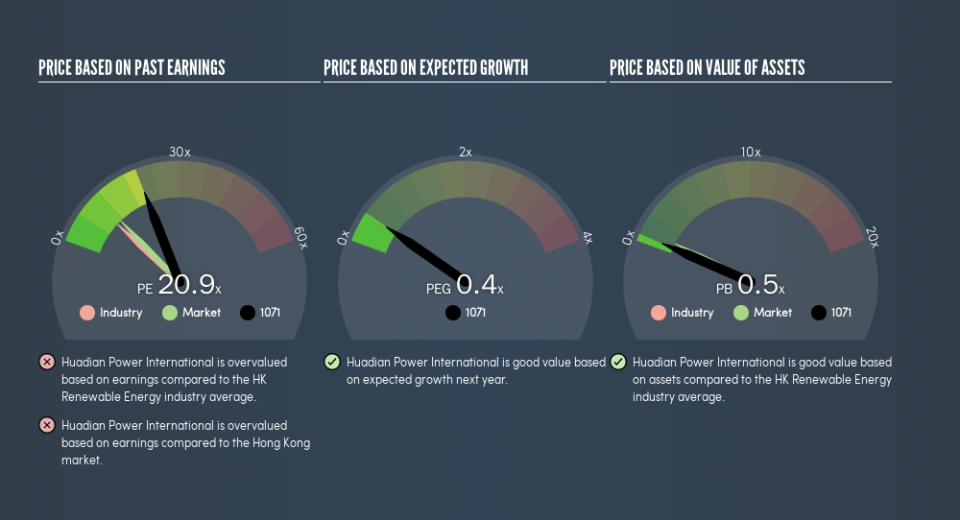
The goal of this article is to teach you how to use price to earnings ratios (P/E ratios). We'll look at Huadian Power International Corporation Limited's (HKG:1071) P/E ratio and reflect on what it tells us about the company's share price. Huadian Power International has a P/E ratio of 20.87, based on the last twelve months. That means that at current prices, buyers pay HK$20.87 for every HK$1 in trailing yearly profits.
View our latest analysis for Huadian Power International
How Do You Calculate Huadian Power International's P/E Ratio?
The formula for P/E is:
Price to Earnings Ratio = Price per Share (in the reporting currency) ÷ Earnings per Share (EPS)
Or for Huadian Power International:
P/E of 20.87 = CN¥2.75 (Note: this is the share price in the reporting currency, namely, CNY ) ÷ CN¥0.13 (Based on the year to December 2018.)
Is A High P/E Ratio Good?
A higher P/E ratio means that investors are paying a higher price for each HK$1 of company earnings. All else being equal, it's better to pay a low price -- but as Warren Buffett said, 'It's far better to buy a wonderful company at a fair price than a fair company at a wonderful price.'
How Growth Rates Impact P/E Ratios
Companies that shrink earnings per share quickly will rapidly decrease the 'E' in the equation. That means even if the current P/E is low, it will increase over time if the share price stays flat. So while a stock may look cheap based on past earnings, it could be expensive based on future earnings.
It's nice to see that Huadian Power International grew EPS by a stonking 202% in the last year. In contrast, EPS has decreased by 35%, annually, over 5 years.
How Does Huadian Power International's P/E Ratio Compare To Its Peers?
The P/E ratio essentially measures market expectations of a company. As you can see below, Huadian Power International has a higher P/E than the average company (9.9) in the renewable energy industry.
Huadian Power International's P/E tells us that market participants think the company will perform better than its industry peers, going forward. Clearly the market expects growth, but it isn't guaranteed. So further research is always essential. I often monitor director buying and selling.
A Limitation: P/E Ratios Ignore Debt and Cash In The Bank
It's important to note that the P/E ratio considers the market capitalization, not the enterprise value. That means it doesn't take debt or cash into account. Hypothetically, a company could reduce its future P/E ratio by spending its cash (or taking on debt) to achieve higher earnings.
Such expenditure might be good or bad, in the long term, but the point here is that the balance sheet is not reflected by this ratio.
Huadian Power International's Balance Sheet
Huadian Power International's net debt is considerable, at 281% of its market cap. This level of debt justifies a relatively low P/E, so remain cognizant of the debt, if you're comparing it to other stocks.
The Verdict On Huadian Power International's P/E Ratio
Huadian Power International trades on a P/E ratio of 20.9, which is above the HK market average of 11.2. It has already proven it can grow earnings, but the debt levels mean it faces some risks. It seems the market believes growth will continue, judging by the P/E ratio.
Investors should be looking to buy stocks that the market is wrong about. People often underestimate remarkable growth -- so investors can make money when fast growth is not fully appreciated. So this free visual report on analyst forecasts could hold the key to an excellent investment decision.
Of course, you might find a fantastic investment by looking at a few good candidates. So take a peek at this free list of companies with modest (or no) debt, trading on a P/E below 20.
We aim to bring you long-term focused research analysis driven by fundamental data. Note that our analysis may not factor in the latest price-sensitive company announcements or qualitative material.
If you spot an error that warrants correction, please contact the editor at editorial-team@simplywallst.com. This article by Simply Wall St is general in nature. It does not constitute a recommendation to buy or sell any stock, and does not take account of your objectives, or your financial situation. Simply Wall St has no position in the stocks mentioned. Thank you for reading.
