Is Hudbay Minerals Inc’s (TSE:HBM) Balance Sheet Strong Enough To Weather A Storm?

While small-cap stocks, such as Hudbay Minerals Inc (TSX:HBM) with its market cap of CA$2.58B, are popular for their explosive growth, investors should also be aware of their balance sheet to judge whether the company can survive a downturn. Assessing first and foremost the financial health is crucial, as mismanagement of capital can lead to bankruptcies, which occur at a higher rate for small-caps. Here are few basic financial health checks you should consider before taking the plunge. Nevertheless, given that I have not delve into the company-specifics, I suggest you dig deeper yourself into HBM here.
Does HBM generate an acceptable amount of cash through operations?
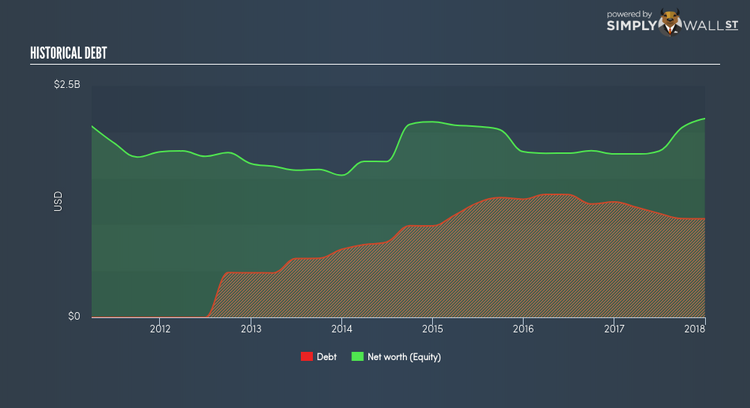
HBM’s debt levels have fallen from US$1.25B to US$1.06B over the last 12 months – this includes both the current and long-term debt. With this reduction in debt, the current cash and short-term investment levels stands at US$356.50M , ready to deploy into the business. Additionally, HBM has generated US$539.58M in operating cash flow during the same period of time, leading to an operating cash to total debt ratio of 50.70%, signalling that HBM’s debt is appropriately covered by operating cash. This ratio can also be interpreted as a measure of efficiency as an alternative to return on assets. In HBM’s case, it is able to generate 0.51x cash from its debt capital.
Can HBM meet its short-term obligations with the cash in hand?
At the current liabilities level of US$356.87M liabilities, it appears that the company has maintained a safe level of current assets to meet its obligations, with the current ratio last standing at 1.86x. For Metals and Mining companies, this ratio is within a sensible range since there’s sufficient cash cushion without leaving too much capital idle or in low-earning investments.
Is HBM’s debt level acceptable?
With debt reaching 49.63% of equity, HBM may be thought of as relatively highly levered. This is not unusual for small-caps as debt tends to be a cheaper and faster source of funding for some businesses. We can test if HBM’s debt levels are sustainable by measuring interest payments against earnings of a company. Ideally, earnings before interest and tax (EBIT) should cover net interest by at least three times. For HBM, the ratio of 4.17x suggests that interest is appropriately covered, which means that lenders may be less hesitant to lend out more funding as HBM’s high interest coverage is seen as responsible and safe practice.
Next Steps:
HBM’s high cash coverage means that, although its debt levels are high, the company is able to utilise its borrowings efficiently in order to generate cash flow. This may mean this is an optimal capital structure for the business, given that it is also meeting its short-term commitment. I admit this is a fairly basic analysis for HBM’s financial health. Other important fundamentals need to be considered alongside. I suggest you continue to research Hudbay Minerals to get a better picture of the small-cap by looking at the areas below. Just a heads up – to access some parts of the Simply Wall St research tool you might be asked to create a free account, but it takes just one click and the information they provide is definitely worth it in my opinion.
1. Future Outlook: What are well-informed industry analysts predicting for HBM’s future growth? Take a look at this free research report of analyst consensus for HBM’s outlook.
2. Historical Performance: What has HBM’s returns been like over the past? Go into more detail in the past track record analysis and take a look at the free visual representations of HBM’s historicals for more clarity.
3. Other High-Performing Stocks: Are there other stocks that provide better prospects with proven track records? Explore a free list of these great stocks here.
To help readers see pass the short term volatility of the financial market, we aim to bring you a long-term focused research analysis purely driven by fundamental data. Note that our analysis does not factor in the latest price sensitive company announcements.
The author is an independent contributor and at the time of publication had no position in the stocks mentioned.
