Hyatt (H) Q3 Earnings Beat, Revenues Miss, Shares Down
Hyatt Hotels Corporation H delivered third-quarter 2023 results, wherein earnings surpassed the Zacks Consensus Estimate, while revenues missed the same. However, both metrics increased on a year-over-year basis.
Hyatt’s quarterly results reflected year-over-year growth in comparable system-wide revenue per available room (RevPAR), driven by an increase in occupancy and average daily rate (ADR). This uptrend is primarily driven by robust global travel demand, especially among leisure guests and group customers. Also, net rooms growth fueled solid fee generation, which the company expects to continue in the upcoming period, given the positive trends. However, increased costs and expenses, foreign currency risks and the ongoing macroeconomic uncertainties partially offset the aforementioned tailwinds.
Following the results, shares of this global hospitality company declined 1.9% in the pre-market trading session on Nov 2.
Q3 Earnings & Revenues
During the quarter under discussion, Hyatt reported adjusted earnings per share (EPS) of 70 cents, beating the Zacks Consensus Estimate of earnings of 60 cents per share by 16.7%. In the prior-year quarter, the company reported EPS of 64 cents.
Hyatt Hotels Corporation Price, Consensus and EPS Surprise
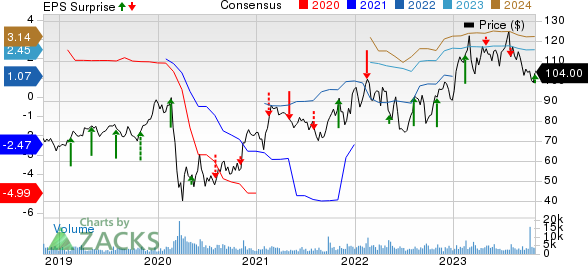
Hyatt Hotels Corporation price-consensus-eps-surprise-chart | Hyatt Hotels Corporation Quote
Quarterly revenues of $1,622 million missed the consensus mark of $1,623 million by 0.1%. However, the top line climbed 5.3% on a year-over-year basis.
Operating Highlights
During the quarter, adjusted EBITDA was $247 million, down 1.7% year over year. Our model predicted the metric to be $250.2 million. Adjusted EBITDA margin decreased to 28.2% compared with 29.8% reported in the year-ago quarter.
Segmental Details
Hyatt manages business through five reportable segments, which are Owned and Leased Hotels; Americas Management and Franchising; Southeast Asia, Greater China, Australia, South Korea, Japan and Micronesia (ASPAC) Management and Franchising; Europe, Africa, Middle East and Southwest Asia (EAME/SW Asia) Management and Franchising; and Apple Leisure Group.
During the quarter under review, adjusted revenues in the Owned and Leased Hotels segment totaled $318 million, up 5.8% year over year. The segment benefited from growth in group travel and robust leisure demand. Our model estimated the revenues to be $321.8 million year over year.
Segmental RevPAR grew 6.3% from the prior-year quarter’s level. ADR was up 2.1% and occupancy rate expanded 2.9 percentage points from 2022 levels.
The segment’s adjusted EBITDA was $50 million compared with $51 million reported in the year-ago quarter.
Americas Management and Franchise segment’s total adjusted fee revenues amounted to $157 million, up 0.2% year over year. Our model estimated the metric to grow 3.7% year over year to $160.7 million.
RevPAR for comparable Americas hotels rose 2.9% from the prior-year quarter’s level. ADR improved 0.9% and occupancy rate moved up 1.4 percentage points from the prior-year quarter’s numbers.
Segmental adjusted EBITDA declined 0.2% year over year to $114 million.
In ASPAC Management and Franchising, RevPAR for comparable ASPAC hotels grew 41.6% from the year-earlier quarter’s figure. ADR grew 17% and occupancy rate improved 12.6 percentage points from the year-ago quarter’s levels. The uptrend was backed by major events, including the G20 Summit, Women's FIFA World Cup and Asian Games.
Adjusted EBITDA was $28 million compared with $18 million in the prior-year quarter.
In EAME/SW Asia Management and Franchising, comparable EAME/SW Asia hotels’ RevPAR increased 5.2% from the year-ago quarter’s levels. ADR increased 1.2% and occupancy rate rose 2.7 percentage points from the year-ago quarter’s numbers. This was driven by Western Europe, strong international inbound seasonal demand and increased airlift into the region.
Adjusted EBITDA totaled $16 million compared with $18 million in the year-ago quarter.
In the Apple Leisure Group segment, adjusted revenues declined 2.4% year over year to $329 million. Our model hinted at an increase of 4.6% year over year.
Adjusted EBITDA was $50 million compared with $78 million reported in the year-ago quarter.
Balance Sheet
As of Sep 30, 2023, Hyatt reported cash and cash equivalents of $727 million compared with $906 million reported in the previous quarter. Total debt as of Sep 30, 2023, was $3,055 million compared with $3,102 million as of Mar 31, 2023.
Other Business Updates
Coming to hotel openings, 20 new hotels (or 3,262 rooms) joined Hyatt's system in the third quarter of 2023. As of Sep 30, 2023, Hyatt executed management or franchise contracts for approximately 600 hotels (or 123,000 rooms).
Revised 2023 Outlook
For 2023, the company now expects adjusted selling, general and administrative expenses to be between $480 million and $490 million compared with the prior estimate of $485 million and $495 million. Capital expenditures are projected to be approximately $190 million compared with the prior expectation of approximately $200 million. Net rooms growth in 2023 is anticipated to be approximately 6% year over year.
Management anticipates 2023 system-wide RevPAR to rise 15-16% (earlier guidance: 14-16%) from 2022 levels. Adjusted EBITDA is estimated in the $1,005 - $1,025 million band, down from $1,020-$1,070 million expected earlier.
Zacks Rank
Hyatt currently carries a Zacks Rank #3 (Hold). You can see the complete list of today’s Zacks #1 Rank (Strong Buy) stocks here.
Recent Consumer Discretionary Releases
Royal Caribbean Cruises Ltd. RCL reported third-quarter 2023 results, with earnings and revenues beating the Zacks Consensus Estimate. The top and the bottom line increased on a year-over-year basis.
The upside was primarily driven by solid cruising demand, improvement in load factors and onboard spending momentum. A rise in close-in demand (at higher prices) and continued strength in onboard revenues added to the positives.
Mattel, Inc. MAT reported third-quarter 2023 results, with earnings and revenues beating the Zacks Consensus Estimate. Also, the top and bottom lines increased on a year-over-year basis.
The upside was attributed to the benefits related to the Barbie movie, favorable pricing, savings from the Optimizing for Growth program and cost deflation. However, unfavorable fixed cost absorption and supply-chain costs partially offset the tailwinds.
Hasbro, Inc. HAS reported mixed third-quarter fiscal 2023 results, wherein earnings came in line with the Zacks Consensus Estimate but revenues missed the same. The top line fell short of the consensus estimate after beating it in the preceding two quarters.
Disappointing Consumer Products and Entertainment revenues hurt the company’s top line, driven by planned license exits, a decline in toy and game volume given the broad category trends, unfavorable pricing and mix along with writers and actors strikes.
Want the latest recommendations from Zacks Investment Research? Today, you can download 7 Best Stocks for the Next 30 Days. Click to get this free report
Hyatt Hotels Corporation (H) : Free Stock Analysis Report
Hasbro, Inc. (HAS) : Free Stock Analysis Report
Royal Caribbean Cruises Ltd. (RCL) : Free Stock Analysis Report
Mattel, Inc. (MAT) : Free Stock Analysis Report
