IMI plc (LON:IMI): What Does Its Beta Value Mean For Your Portfolio?

If you're interested in IMI plc (LON:IMI), then you might want to consider its beta (a measure of share price volatility) in order to understand how the stock could impact your portfolio. Volatility is considered to be a measure of risk in modern finance theory. Investors may think of volatility as falling into two main categories. The first type is company specific volatility. Investors use diversification across uncorrelated stocks to reduce this kind of price volatility across the portfolio. The second type is the broader market volatility, which you cannot diversify away, since it arises from macroeconomic factors which directly affects all the stocks on the market.
Some stocks mimic the volatility of the market quite closely, while others demonstrate muted, exagerrated or uncorrelated price movements. Beta is a widely used metric to measure a stock's exposure to market risk (volatility). Before we go on, it's worth noting that Warren Buffett pointed out in his 2014 letter to shareholders that 'volatility is far from synonymous with risk.' Having said that, beta can still be rather useful. The first thing to understand about beta is that the beta of the overall market is one. Any stock with a beta of greater than one is considered more volatile than the market, while those with a beta below one are either less volatile or poorly correlated with the market.
View our latest analysis for IMI
What IMI's beta value tells investors
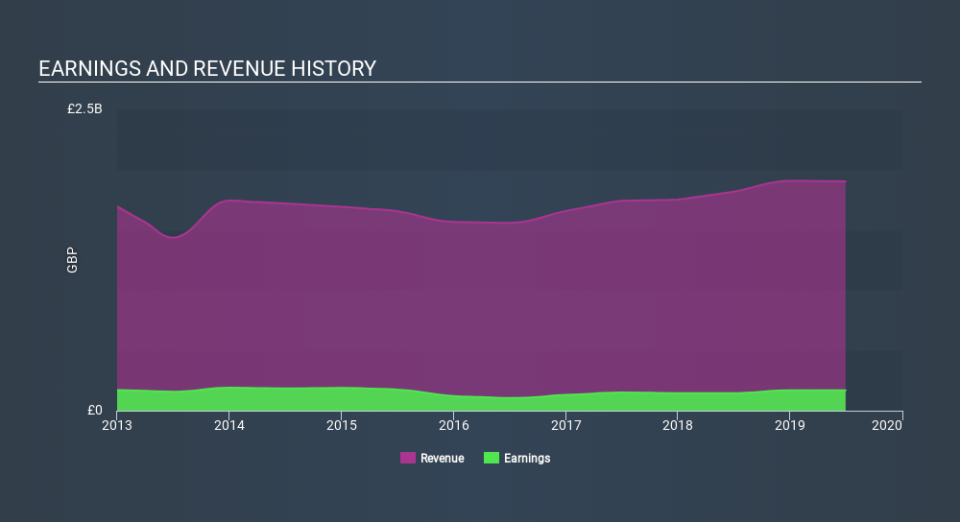
IMI has a five-year beta of 1.04. This is reasonably close to the market beta of 1, so the stock has in the past displayed similar levels of volatility to the overall market. While history does not always repeat, this may indicate that the stock price will continue to be exposed to market risk, albeit not overly so. Share price volatility is well worth considering, but most long term investors consider the history of revenue and earnings growth to be more important. Take a look at how IMI fares in that regard, below.
Does IMI's size influence the expected beta?
IMI is a reasonably big company, with a market capitalisation of UK£3.0b. Most companies this size are actively traded with decent volumes of shares changing hands each day. It's not overly surprising to see large companies with beta values reasonably close to the market average. After all, large companies make up a higher weighting of the index than do small companies.
What this means for you:
IMI has a beta value quite close to that of the overall market. That doesn't tell us much on its own, so it is probably worth considering whether the company is growing, if you're looking for stocks that will go up more than the overall market. This article aims to educate investors about beta values, but it's well worth looking at important company-specific fundamentals such as IMI’s financial health and performance track record. I highly recommend you dive deeper by considering the following:
Future Outlook: What are well-informed industry analysts predicting for IMI’s future growth? Take a look at our free research report of analyst consensus for IMI’s outlook.
Past Track Record: Has IMI been consistently performing well irrespective of the ups and downs in the market? Go into more detail in the past performance analysis and take a look at the free visual representations of IMI's historicals for more clarity.
Other Interesting Stocks: It's worth checking to see how IMI measures up against other companies on valuation. You could start with this free list of prospective options.
If you spot an error that warrants correction, please contact the editor at editorial-team@simplywallst.com. This article by Simply Wall St is general in nature. It does not constitute a recommendation to buy or sell any stock, and does not take account of your objectives, or your financial situation. Simply Wall St has no position in the stocks mentioned.
We aim to bring you long-term focused research analysis driven by fundamental data. Note that our analysis may not factor in the latest price-sensitive company announcements or qualitative material. Thank you for reading.
