IMI plc (LON:IMI) Stock Has Shown Weakness Lately But Financials Look Strong: Should Prospective Shareholders Make The Leap?
IMI (LON:IMI) has had a rough three months with its share price down 4.4%. However, stock prices are usually driven by a company’s financial performance over the long term, which in this case looks quite promising. Particularly, we will be paying attention to IMI's ROE today.
Return on equity or ROE is a key measure used to assess how efficiently a company's management is utilizing the company's capital. In other words, it is a profitability ratio which measures the rate of return on the capital provided by the company's shareholders.
See our latest analysis for IMI
How Is ROE Calculated?
Return on equity can be calculated by using the formula:
Return on Equity = Net Profit (from continuing operations) ÷ Shareholders' Equity
So, based on the above formula, the ROE for IMI is:
26% = UK£241m ÷ UK£920m (Based on the trailing twelve months to June 2023).
The 'return' is the yearly profit. One way to conceptualize this is that for each £1 of shareholders' capital it has, the company made £0.26 in profit.
What Is The Relationship Between ROE And Earnings Growth?
We have already established that ROE serves as an efficient profit-generating gauge for a company's future earnings. Depending on how much of these profits the company reinvests or "retains", and how effectively it does so, we are then able to assess a company’s earnings growth potential. Assuming everything else remains unchanged, the higher the ROE and profit retention, the higher the growth rate of a company compared to companies that don't necessarily bear these characteristics.
IMI's Earnings Growth And 26% ROE
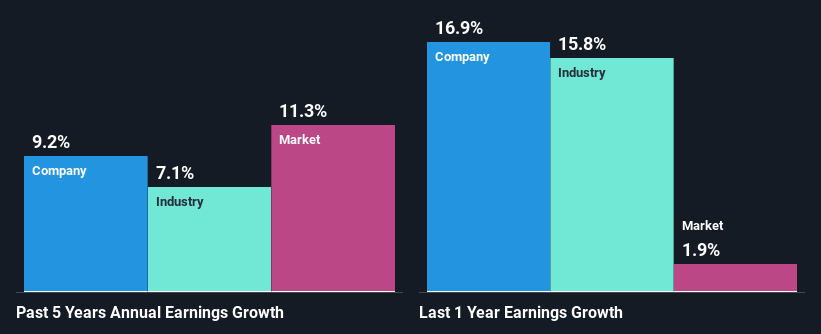
To begin with, IMI has a pretty high ROE which is interesting. Secondly, even when compared to the industry average of 14% the company's ROE is quite impressive. This likely paved the way for the modest 9.2% net income growth seen by IMI over the past five years.
Next, on comparing with the industry net income growth, we found that IMI's growth is quite high when compared to the industry average growth of 7.1% in the same period, which is great to see.
The basis for attaching value to a company is, to a great extent, tied to its earnings growth. What investors need to determine next is if the expected earnings growth, or the lack of it, is already built into the share price. Doing so will help them establish if the stock's future looks promising or ominous. What is IMI worth today? The intrinsic value infographic in our free research report helps visualize whether IMI is currently mispriced by the market.
Is IMI Making Efficient Use Of Its Profits?
IMI has a three-year median payout ratio of 32%, which implies that it retains the remaining 68% of its profits. This suggests that its dividend is well covered, and given the decent growth seen by the company, it looks like management is reinvesting its earnings efficiently.
Additionally, IMI has paid dividends over a period of at least ten years which means that the company is pretty serious about sharing its profits with shareholders. Upon studying the latest analysts' consensus data, we found that the company's future payout ratio is expected to drop to 25% over the next three years. However, the company's ROE is not expected to change by much despite the lower expected payout ratio.
Summary
In total, we are pretty happy with IMI's performance. Particularly, we like that the company is reinvesting heavily into its business, and at a high rate of return. Unsurprisingly, this has led to an impressive earnings growth. The latest industry analyst forecasts show that the company is expected to maintain its current growth rate. To know more about the company's future earnings growth forecasts take a look at this free report on analyst forecasts for the company to find out more.
Have feedback on this article? Concerned about the content? Get in touch with us directly. Alternatively, email editorial-team (at) simplywallst.com.
This article by Simply Wall St is general in nature. We provide commentary based on historical data and analyst forecasts only using an unbiased methodology and our articles are not intended to be financial advice. It does not constitute a recommendation to buy or sell any stock, and does not take account of your objectives, or your financial situation. We aim to bring you long-term focused analysis driven by fundamental data. Note that our analysis may not factor in the latest price-sensitive company announcements or qualitative material. Simply Wall St has no position in any stocks mentioned.
