Is Impinj (PI) Too Good to Be True? A Comprehensive Analysis of a Potential Value Trap
Value-focused investors are always on the hunt for stocks that are priced below their intrinsic value. One such stock that merits attention is Impinj Inc (NASDAQ:PI). The stock, which is currently priced at $61.02, recorded a loss of 1.8% in a day and a 3-month decrease of 33.06%. The stock's fair valuation is $102.98, as indicated by its GF Value.
Understanding the GF Value
The GF Value represents the current intrinsic value of a stock derived from our exclusive method. The GF Value Line on our summary page gives an overview of the fair value that the stock should be traded at. It is calculated based on three factors: historical multiples (PE Ratio, PS Ratio, PB Ratio and Price-to-Free-Cash-Flow) that the stock has traded at, GuruFocus adjustment factor based on the company's past returns and growth, and future estimates of the business performance.
We believe the GF Value Line is the fair value that the stock should be traded at. The stock price will most likely fluctuate around the GF Value Line. If the stock price is significantly above the GF Value Line, it is overvalued and its future return is likely to be poor. On the other hand, if it is significantly below the GF Value Line, its future return will likely be higher.
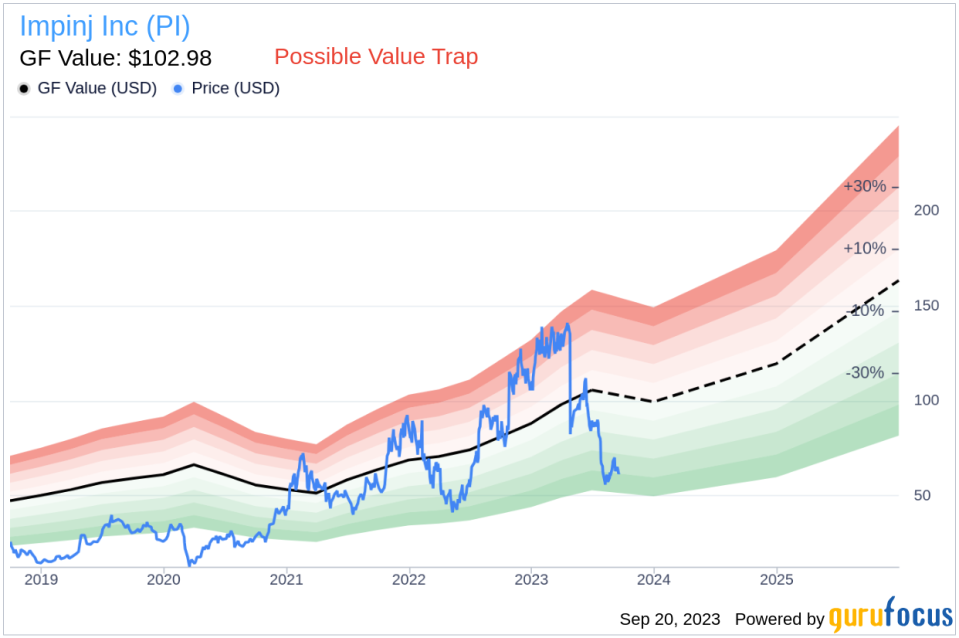
Impinj: A Potential Value Trap?
However, investors need to consider a more in-depth analysis before making an investment decision. Despite its seemingly attractive valuation, certain risk factors associated with Impinj should not be ignored. These risks are primarily reflected through its low Beneish M-Score of -1.58 that exceeds -1.78, the threshold for potential earnings manipulation. These indicators suggest that Impinj, despite its apparent undervaluation, might be a potential value trap. This complexity underlines the importance of thorough due diligence in investment decision-making.
Decoding the Beneish M-Score
Developed by Professor Messod Beneish, the Beneish M-Score is based on eight financial variables that reflect different aspects of a company's financial performance and position. These are Days Sales Outstanding (DSO), Gross Margin (GM), Total Long-term Assets Less Property, Plant and Equipment over Total Assets (TATA), change in Revenue (?REV), change in Depreciation and Amortization (?DA), change in Selling, General and Admin expenses (?SGA), change in Debt-to-Asset Ratio (?LVG), and Net Income Less Non-Operating Income and Cash Flow from Operations over Total Assets (?NOATA).
Impinj: A Closer Look at the Financials
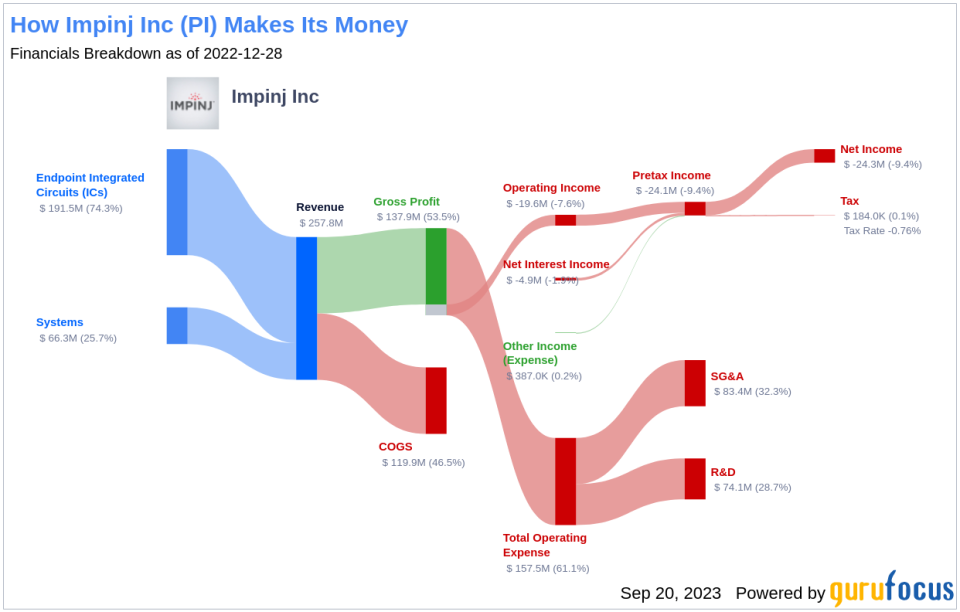
Impinj Inc operates a platform that enables wireless connectivity to everyday items by delivering each item's identity, location, and authenticity to business and consumer applications. Its platform includes endpoint integrated circuits (ICs) product, a miniature radios-on-a-chip, which attach to and identify their host items; and connectivity layer that comprises readers, gateways, and reader ICs to wirelessly identify, locate, authenticate, and engage endpoints via RAIN, as well as provide power to and communicate bidirectionally with endpoint ICs.
Looking at the historical data from the past three years (2021: 0.75; 2022: 0.78; 2023: 0.91), there appears to be a rising trend in Impinj's DSO. An uptick in DSO might indicate aggressive revenue recognition practices, and in some cases, potential earnings manipulation. A rising DSO figure warrants scrutiny as it can signal financial distress or questionable accounting practices within the company.
By examining the past three years of Impinj's historical data (2021: 49.34; 2022: 53.38; 2023: 52.08), we find that its Gross Margin has contracted by 4.56%. Such a contraction in the gross margin can negatively impact the company's profitability as it signifies lesser income from each dollar of sales. This could put a strain on the company's capacity to manage operating costs, potentially undermining its financial stability.
Analyzing Impinj's asset quality ratio over the past three years (2021: 0.03; 2022: 0.09; 2023: 0.11), an increase might signal underlying issues, such as capitalizing normal operating expenses or goodwill impairment. These factors can inflate assets and mask true operational costs, potentially misrepresenting the company's actual financial position, and raising concerns for investors about its true value and risk profile.
For Impinj, the current TATA ratio (TTM) stands at 0.056. A positive TATA ratio can be a warning sign, suggesting that the earnings are composed more of accruals rather than cash flow, which could be an indication of aggressive income recognition. In essence, a higher TATA ratio might mean that the company's reported income is not as firmly grounded in real cash earnings, signaling poor quality of earnings, potentially resulting from accounting gimmicks or financial engineering rather than true operational performance.
Impinj: A Value Trap?
Given the analysis, Impinj appears to be a potential value trap. Despite its seemingly attractive valuation, the company exhibits several risk factors that could undermine its investment potential. These include a rising trend in DSO, a contraction in gross margin, an increasing asset quality ratio, and a positive TATA ratio. Therefore, investors should conduct thorough due diligence before making an investment decision.
To find out the high quality companies that may deliver above average returns, please check out GuruFocus High Quality Low Capex Screener.
This article first appeared on GuruFocus.
