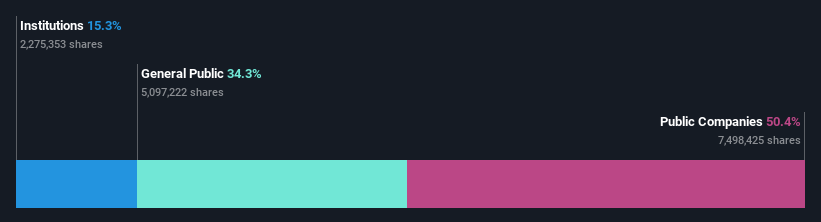
Individual investors own 34% of Aumann AG (ETR:AAG) shares but public companies control 50% of the company
Key Insights
Aumann's significant public companies ownership suggests that the key decisions are influenced by shareholders from the larger public
The largest shareholder of the company is MBB SE with a 50% stake
If you want to know who really controls Aumann AG (ETR:AAG), then you'll have to look at the makeup of its share registry. We can see that public companies own the lion's share in the company with 50% ownership. Put another way, the group faces the maximum upside potential (or downside risk).
Individual investors, on the other hand, account for 34% of the company's stockholders.
Let's delve deeper into each type of owner of Aumann, beginning with the chart below.
View our latest analysis for Aumann
What Does The Institutional Ownership Tell Us About Aumann?
Institutional investors commonly compare their own returns to the returns of a commonly followed index. So they generally do consider buying larger companies that are included in the relevant benchmark index.
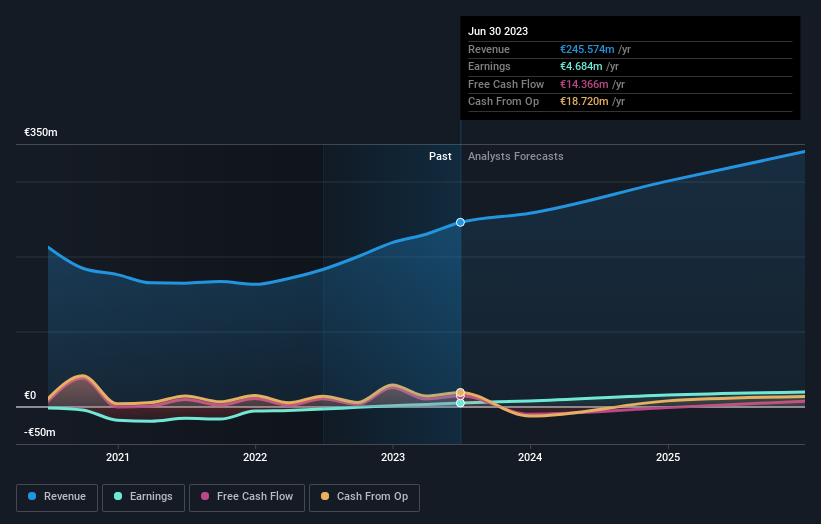
As you can see, institutional investors have a fair amount of stake in Aumann. This suggests some credibility amongst professional investors. But we can't rely on that fact alone since institutions make bad investments sometimes, just like everyone does. It is not uncommon to see a big share price drop if two large institutional investors try to sell out of a stock at the same time. So it is worth checking the past earnings trajectory of Aumann, (below). Of course, keep in mind that there are other factors to consider, too.
Hedge funds don't have many shares in Aumann. Our data shows that MBB SE is the largest shareholder with 50% of shares outstanding. This implies that they have majority interest control of the future of the company. In comparison, the second and third largest shareholders hold about 3.1% and 3.0% of the stock.
While it makes sense to study institutional ownership data for a company, it also makes sense to study analyst sentiments to know which way the wind is blowing. There are a reasonable number of analysts covering the stock, so it might be useful to find out their aggregate view on the future.
Insider Ownership Of Aumann
The definition of company insiders can be subjective and does vary between jurisdictions. Our data reflects individual insiders, capturing board members at the very least. Management ultimately answers to the board. However, it is not uncommon for managers to be executive board members, especially if they are a founder or the CEO.
I generally consider insider ownership to be a good thing. However, on some occasions it makes it more difficult for other shareholders to hold the board accountable for decisions.
We note our data does not show any board members holding shares, personally. It is unusual not to have at least some personal holdings by board members, so our data might be flawed. A good next step would be to check how much the CEO is paid.
General Public Ownership
The general public, who are usually individual investors, hold a 34% stake in Aumann. While this group can't necessarily call the shots, it can certainly have a real influence on how the company is run.
Public Company Ownership
It appears to us that public companies own 50% of Aumann. We can't be certain but it is quite possible this is a strategic stake. The businesses may be similar, or work together.
Next Steps:
It's always worth thinking about the different groups who own shares in a company. But to understand Aumann better, we need to consider many other factors. Consider for instance, the ever-present spectre of investment risk. We've identified 1 warning sign with Aumann , and understanding them should be part of your investment process.
Ultimately the future is most important. You can access this free report on analyst forecasts for the company.
NB: Figures in this article are calculated using data from the last twelve months, which refer to the 12-month period ending on the last date of the month the financial statement is dated. This may not be consistent with full year annual report figures.
Have feedback on this article? Concerned about the content? Get in touch with us directly. Alternatively, email editorial-team (at) simplywallst.com.
This article by Simply Wall St is general in nature. We provide commentary based on historical data and analyst forecasts only using an unbiased methodology and our articles are not intended to be financial advice. It does not constitute a recommendation to buy or sell any stock, and does not take account of your objectives, or your financial situation. We aim to bring you long-term focused analysis driven by fundamental data. Note that our analysis may not factor in the latest price-sensitive company announcements or qualitative material. Simply Wall St has no position in any stocks mentioned.
