Ingenia Communities Group's (ASX:INA) investors will be pleased with their impressive 171% return over the last five years
When you buy shares in a company, it's worth keeping in mind the possibility that it could fail, and you could lose your money. But on a lighter note, a good company can see its share price rise well over 100%. One great example is Ingenia Communities Group (ASX:INA) which saw its share price drive 129% higher over five years. The last week saw the share price soften some 1.3%.
With that in mind, it's worth seeing if the company's underlying fundamentals have been the driver of long term performance, or if there are some discrepancies.
Check out our latest analysis for Ingenia Communities Group
While the efficient markets hypothesis continues to be taught by some, it has been proven that markets are over-reactive dynamic systems, and investors are not always rational. One flawed but reasonable way to assess how sentiment around a company has changed is to compare the earnings per share (EPS) with the share price.
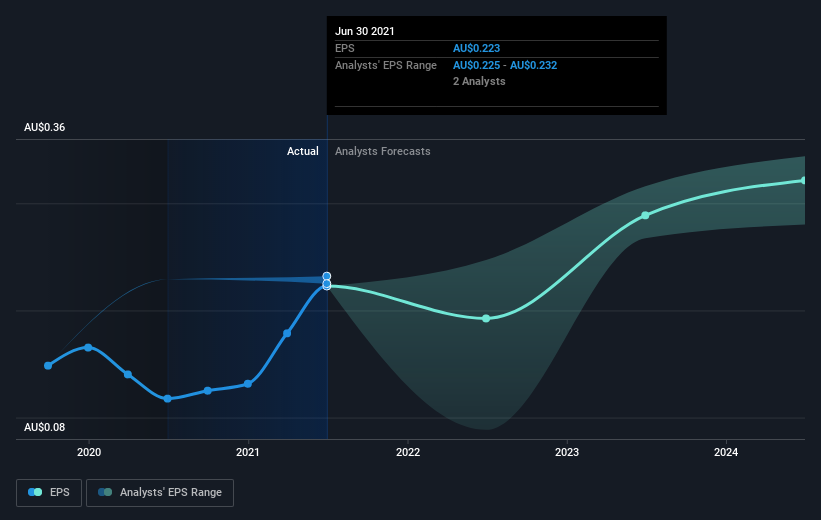
Over half a decade, Ingenia Communities Group managed to grow its earnings per share at 2.1% a year. This EPS growth is lower than the 18% average annual increase in the share price. This suggests that market participants hold the company in higher regard, these days. That's not necessarily surprising considering the five-year track record of earnings growth.
The company's earnings per share (over time) is depicted in the image below (click to see the exact numbers).
We know that Ingenia Communities Group has improved its bottom line lately, but is it going to grow revenue? This free report showing analyst revenue forecasts should help you figure out if the EPS growth can be sustained.
What About Dividends?
It is important to consider the total shareholder return, as well as the share price return, for any given stock. The TSR incorporates the value of any spin-offs or discounted capital raisings, along with any dividends, based on the assumption that the dividends are reinvested. It's fair to say that the TSR gives a more complete picture for stocks that pay a dividend. In the case of Ingenia Communities Group, it has a TSR of 171% for the last 5 years. That exceeds its share price return that we previously mentioned. The dividends paid by the company have thusly boosted the total shareholder return.
A Different Perspective
We're pleased to report that Ingenia Communities Group shareholders have received a total shareholder return of 30% over one year. And that does include the dividend. Since the one-year TSR is better than the five-year TSR (the latter coming in at 22% per year), it would seem that the stock's performance has improved in recent times. In the best case scenario, this may hint at some real business momentum, implying that now could be a great time to delve deeper. It's always interesting to track share price performance over the longer term. But to understand Ingenia Communities Group better, we need to consider many other factors. Even so, be aware that Ingenia Communities Group is showing 2 warning signs in our investment analysis , you should know about...
Of course, you might find a fantastic investment by looking elsewhere. So take a peek at this free list of companies we expect will grow earnings.
Please note, the market returns quoted in this article reflect the market weighted average returns of stocks that currently trade on AU exchanges.
Have feedback on this article? Concerned about the content? Get in touch with us directly. Alternatively, email editorial-team (at) simplywallst.com.
This article by Simply Wall St is general in nature. We provide commentary based on historical data and analyst forecasts only using an unbiased methodology and our articles are not intended to be financial advice. It does not constitute a recommendation to buy or sell any stock, and does not take account of your objectives, or your financial situation. We aim to bring you long-term focused analysis driven by fundamental data. Note that our analysis may not factor in the latest price-sensitive company announcements or qualitative material. Simply Wall St has no position in any stocks mentioned.
