Are Innergex Renewable Energy Inc. (TSE:INE) Investors Paying Above The Intrinsic Value?
Key Insights
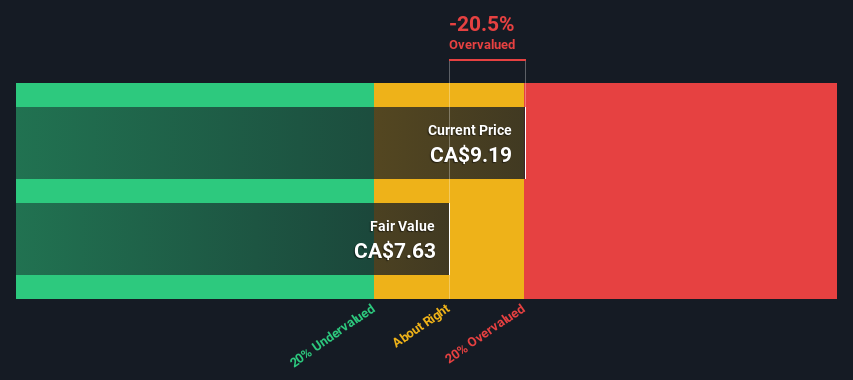
Using the 2 Stage Free Cash Flow to Equity, Innergex Renewable Energy fair value estimate is CA$7.63
Innergex Renewable Energy is estimated to be 20% overvalued based on current share price of CA$9.19
The CA$14.14 analyst price target for INE is 85% more than our estimate of fair value
How far off is Innergex Renewable Energy Inc. (TSE:INE) from its intrinsic value? Using the most recent financial data, we'll take a look at whether the stock is fairly priced by taking the expected future cash flows and discounting them to today's value. The Discounted Cash Flow (DCF) model is the tool we will apply to do this. Models like these may appear beyond the comprehension of a lay person, but they're fairly easy to follow.
Remember though, that there are many ways to estimate a company's value, and a DCF is just one method. Anyone interested in learning a bit more about intrinsic value should have a read of the Simply Wall St analysis model.
Check out our latest analysis for Innergex Renewable Energy
The Model
We are going to use a two-stage DCF model, which, as the name states, takes into account two stages of growth. The first stage is generally a higher growth period which levels off heading towards the terminal value, captured in the second 'steady growth' period. To start off with, we need to estimate the next ten years of cash flows. Where possible we use analyst estimates, but when these aren't available we extrapolate the previous free cash flow (FCF) from the last estimate or reported value. We assume companies with shrinking free cash flow will slow their rate of shrinkage, and that companies with growing free cash flow will see their growth rate slow, over this period. We do this to reflect that growth tends to slow more in the early years than it does in later years.
A DCF is all about the idea that a dollar in the future is less valuable than a dollar today, so we discount the value of these future cash flows to their estimated value in today's dollars:
10-year free cash flow (FCF) estimate
2024 | 2025 | 2026 | 2027 | 2028 | 2029 | 2030 | 2031 | 2032 | 2033 | |
Levered FCF (CA$, Millions) | CA$292.2m | CA$191.0m | CA$140.6m | CA$115.4m | CA$101.6m | CA$93.7m | CA$89.1m | CA$86.6m | CA$85.4m | CA$85.0m |
Growth Rate Estimate Source | Analyst x2 | Analyst x1 | Est @ -26.40% | Est @ -17.90% | Est @ -11.95% | Est @ -7.79% | Est @ -4.87% | Est @ -2.83% | Est @ -1.40% | Est @ -0.40% |
Present Value (CA$, Millions) Discounted @ 8.2% | CA$270 | CA$163 | CA$111 | CA$84.1 | CA$68.5 | CA$58.3 | CA$51.3 | CA$46.0 | CA$41.9 | CA$38.6 |
("Est" = FCF growth rate estimated by Simply Wall St)
Present Value of 10-year Cash Flow (PVCF) = CA$933m
After calculating the present value of future cash flows in the initial 10-year period, we need to calculate the Terminal Value, which accounts for all future cash flows beyond the first stage. For a number of reasons a very conservative growth rate is used that cannot exceed that of a country's GDP growth. In this case we have used the 5-year average of the 10-year government bond yield (1.9%) to estimate future growth. In the same way as with the 10-year 'growth' period, we discount future cash flows to today's value, using a cost of equity of 8.2%.
Terminal Value (TV)= FCF2033 × (1 + g) ÷ (r – g) = CA$85m× (1 + 1.9%) ÷ (8.2%– 1.9%) = CA$1.4b
Present Value of Terminal Value (PVTV)= TV / (1 + r)10= CA$1.4b÷ ( 1 + 8.2%)10= CA$626m
The total value, or equity value, is then the sum of the present value of the future cash flows, which in this case is CA$1.6b. In the final step we divide the equity value by the number of shares outstanding. Compared to the current share price of CA$9.2, the company appears slightly overvalued at the time of writing. The assumptions in any calculation have a big impact on the valuation, so it is better to view this as a rough estimate, not precise down to the last cent.
The Assumptions
The calculation above is very dependent on two assumptions. The first is the discount rate and the other is the cash flows. You don't have to agree with these inputs, I recommend redoing the calculations yourself and playing with them. The DCF also does not consider the possible cyclicality of an industry, or a company's future capital requirements, so it does not give a full picture of a company's potential performance. Given that we are looking at Innergex Renewable Energy as potential shareholders, the cost of equity is used as the discount rate, rather than the cost of capital (or weighted average cost of capital, WACC) which accounts for debt. In this calculation we've used 8.2%, which is based on a levered beta of 1.258. Beta is a measure of a stock's volatility, compared to the market as a whole. We get our beta from the industry average beta of globally comparable companies, with an imposed limit between 0.8 and 2.0, which is a reasonable range for a stable business.
SWOT Analysis for Innergex Renewable Energy
Strength
Dividend is in the top 25% of dividend payers in the market.
Weakness
Interest payments on debt are not well covered.
Opportunity
Forecast to reduce losses next year.
Good value based on P/S ratio compared to estimated Fair P/S ratio.
Threat
Debt is not well covered by operating cash flow.
Has less than 3 years of cash runway based on current free cash flow.
Paying a dividend but company is unprofitable.
Looking Ahead:
Although the valuation of a company is important, it ideally won't be the sole piece of analysis you scrutinize for a company. It's not possible to obtain a foolproof valuation with a DCF model. Preferably you'd apply different cases and assumptions and see how they would impact the company's valuation. If a company grows at a different rate, or if its cost of equity or risk free rate changes sharply, the output can look very different. Why is the intrinsic value lower than the current share price? For Innergex Renewable Energy, we've compiled three further factors you should further examine:
Risks: You should be aware of the 1 warning sign for Innergex Renewable Energy we've uncovered before considering an investment in the company.
Management:Have insiders been ramping up their shares to take advantage of the market's sentiment for INE's future outlook? Check out our management and board analysis with insights on CEO compensation and governance factors.
Other High Quality Alternatives: Do you like a good all-rounder? Explore our interactive list of high quality stocks to get an idea of what else is out there you may be missing!
PS. The Simply Wall St app conducts a discounted cash flow valuation for every stock on the TSX every day. If you want to find the calculation for other stocks just search here.
Have feedback on this article? Concerned about the content? Get in touch with us directly. Alternatively, email editorial-team (at) simplywallst.com.
This article by Simply Wall St is general in nature. We provide commentary based on historical data and analyst forecasts only using an unbiased methodology and our articles are not intended to be financial advice. It does not constitute a recommendation to buy or sell any stock, and does not take account of your objectives, or your financial situation. We aim to bring you long-term focused analysis driven by fundamental data. Note that our analysis may not factor in the latest price-sensitive company announcements or qualitative material. Simply Wall St has no position in any stocks mentioned.
