Installed Building Products' (NYSE:IBP) 41% CAGR outpaced the company's earnings growth over the same five-year period
Long term investing can be life changing when you buy and hold the truly great businesses. And highest quality companies can see their share prices grow by huge amounts. For example, the Installed Building Products, Inc. (NYSE:IBP) share price is up a whopping 432% in the last half decade, a handsome return for long term holders. And this is just one example of the epic gains achieved by some long term investors. Also pleasing for shareholders was the 39% gain in the last three months.
Since the stock has added US$530m to its market cap in the past week alone, let's see if underlying performance has been driving long-term returns.
See our latest analysis for Installed Building Products
In his essay The Superinvestors of Graham-and-Doddsville Warren Buffett described how share prices do not always rationally reflect the value of a business. One way to examine how market sentiment has changed over time is to look at the interaction between a company's share price and its earnings per share (EPS).
During five years of share price growth, Installed Building Products achieved compound earnings per share (EPS) growth of 37% per year. This EPS growth is reasonably close to the 40% average annual increase in the share price. This indicates that investor sentiment towards the company has not changed a great deal. In fact, the share price seems to largely reflect the EPS growth.
You can see below how EPS has changed over time (discover the exact values by clicking on the image).
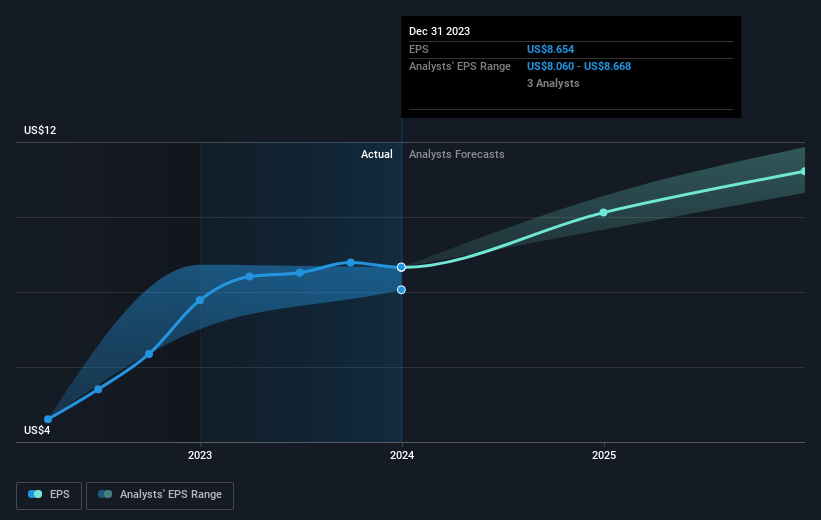
It is of course excellent to see how Installed Building Products has grown profits over the years, but the future is more important for shareholders. Take a more thorough look at Installed Building Products' financial health with this free report on its balance sheet.
What About Dividends?
When looking at investment returns, it is important to consider the difference between total shareholder return (TSR) and share price return. The TSR incorporates the value of any spin-offs or discounted capital raisings, along with any dividends, based on the assumption that the dividends are reinvested. So for companies that pay a generous dividend, the TSR is often a lot higher than the share price return. In the case of Installed Building Products, it has a TSR of 465% for the last 5 years. That exceeds its share price return that we previously mentioned. And there's no prize for guessing that the dividend payments largely explain the divergence!
A Different Perspective
It's nice to see that Installed Building Products shareholders have received a total shareholder return of 140% over the last year. And that does include the dividend. That gain is better than the annual TSR over five years, which is 41%. Therefore it seems like sentiment around the company has been positive lately. Someone with an optimistic perspective could view the recent improvement in TSR as indicating that the business itself is getting better with time. It's always interesting to track share price performance over the longer term. But to understand Installed Building Products better, we need to consider many other factors. Consider risks, for instance. Every company has them, and we've spotted 2 warning signs for Installed Building Products you should know about.
If you like to buy stocks alongside management, then you might just love this free list of companies. (Hint: insiders have been buying them).
Please note, the market returns quoted in this article reflect the market weighted average returns of stocks that currently trade on American exchanges.
Have feedback on this article? Concerned about the content? Get in touch with us directly. Alternatively, email editorial-team (at) simplywallst.com.
This article by Simply Wall St is general in nature. We provide commentary based on historical data and analyst forecasts only using an unbiased methodology and our articles are not intended to be financial advice. It does not constitute a recommendation to buy or sell any stock, and does not take account of your objectives, or your financial situation. We aim to bring you long-term focused analysis driven by fundamental data. Note that our analysis may not factor in the latest price-sensitive company announcements or qualitative material. Simply Wall St has no position in any stocks mentioned.
