Institutions along with individual investors who hold considerable shares inNaspers Limited (JSE:NPN) come under pressure; lose 9.4% of holdings value
Key Insights
Naspers' significant individual investors ownership suggests that the key decisions are influenced by shareholders from the larger public
A total of 25 investors have a majority stake in the company with 40% ownership
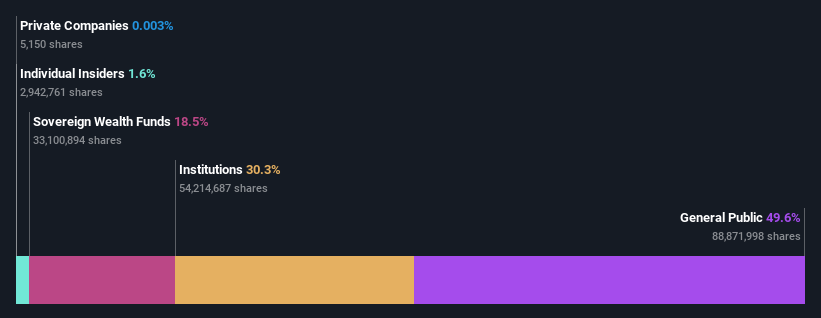
A look at the shareholders of Naspers Limited (JSE:NPN) can tell us which group is most powerful. The group holding the most number of shares in the company, around 50% to be precise, is individual investors. Put another way, the group faces the maximum upside potential (or downside risk).
While the holdings of individual investors took a hit after last week’s 9.4% price drop, institutions with their 30% holdings also suffered.
Let's take a closer look to see what the different types of shareholders can tell us about Naspers.
View our latest analysis for Naspers
What Does The Institutional Ownership Tell Us About Naspers?
Many institutions measure their performance against an index that approximates the local market. So they usually pay more attention to companies that are included in major indices.
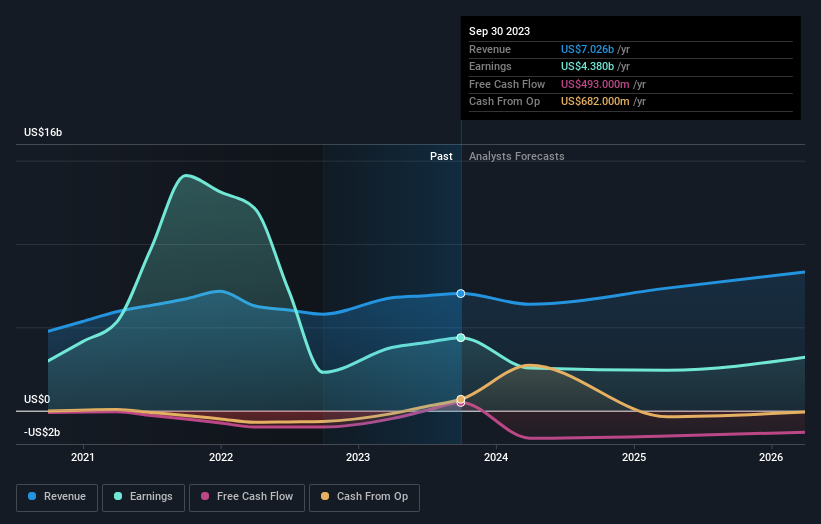
As you can see, institutional investors have a fair amount of stake in Naspers. This implies the analysts working for those institutions have looked at the stock and they like it. But just like anyone else, they could be wrong. When multiple institutions own a stock, there's always a risk that they are in a 'crowded trade'. When such a trade goes wrong, multiple parties may compete to sell stock fast. This risk is higher in a company without a history of growth. You can see Naspers' historic earnings and revenue below, but keep in mind there's always more to the story.
We note that hedge funds don't have a meaningful investment in Naspers. Public Investment Corporation Limited is currently the largest shareholder, with 18% of shares outstanding. For context, the second largest shareholder holds about 4.1% of the shares outstanding, followed by an ownership of 3.1% by the third-largest shareholder.
On studying our ownership data, we found that 25 of the top shareholders collectively own less than 50% of the share register, implying that no single individual has a majority interest.
Researching institutional ownership is a good way to gauge and filter a stock's expected performance. The same can be achieved by studying analyst sentiments. There are plenty of analysts covering the stock, so it might be worth seeing what they are forecasting, too.
Insider Ownership Of Naspers
The definition of company insiders can be subjective and does vary between jurisdictions. Our data reflects individual insiders, capturing board members at the very least. Company management run the business, but the CEO will answer to the board, even if he or she is a member of it.
I generally consider insider ownership to be a good thing. However, on some occasions it makes it more difficult for other shareholders to hold the board accountable for decisions.
Shareholders would probably be interested to learn that insiders own shares in Naspers Limited. The insiders have a meaningful stake worth R8.7b. we sometimes take an interest in whether they have been buying or selling.
General Public Ownership
The general public, who are usually individual investors, hold a 50% stake in Naspers. While this group can't necessarily call the shots, it can certainly have a real influence on how the company is run.
Next Steps:
While it is well worth considering the different groups that own a company, there are other factors that are even more important. Take risks for example - Naspers has 3 warning signs (and 1 which shouldn't be ignored) we think you should know about.
If you would prefer discover what analysts are predicting in terms of future growth, do not miss this free report on analyst forecasts.
NB: Figures in this article are calculated using data from the last twelve months, which refer to the 12-month period ending on the last date of the month the financial statement is dated. This may not be consistent with full year annual report figures.
Have feedback on this article? Concerned about the content? Get in touch with us directly. Alternatively, email editorial-team (at) simplywallst.com.
This article by Simply Wall St is general in nature. We provide commentary based on historical data and analyst forecasts only using an unbiased methodology and our articles are not intended to be financial advice. It does not constitute a recommendation to buy or sell any stock, and does not take account of your objectives, or your financial situation. We aim to bring you long-term focused analysis driven by fundamental data. Note that our analysis may not factor in the latest price-sensitive company announcements or qualitative material. Simply Wall St has no position in any stocks mentioned.
