Institutions along with individual investors who hold considerable shares inSecure Energy Services Inc. (TSE:SES) come under pressure; lose 5.2% of holdings value
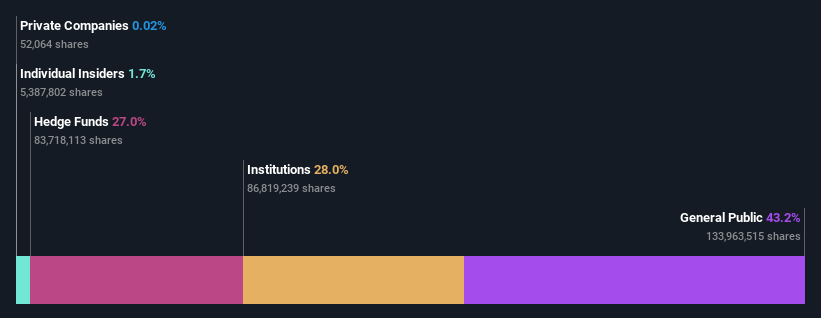
If you want to know who really controls Secure Energy Services Inc. (TSE:SES), then you'll have to look at the makeup of its share registry. We can see that individual investors own the lion's share in the company with 43% ownership. Put another way, the group faces the maximum upside potential (or downside risk).
Following a 5.2% decrease in the stock price last week, individual investors suffered the most losses, but institutions who own 28% stock also took a hit.
Let's delve deeper into each type of owner of Secure Energy Services, beginning with the chart below.
Check out our latest analysis for Secure Energy Services
What Does The Institutional Ownership Tell Us About Secure Energy Services?
Many institutions measure their performance against an index that approximates the local market. So they usually pay more attention to companies that are included in major indices.
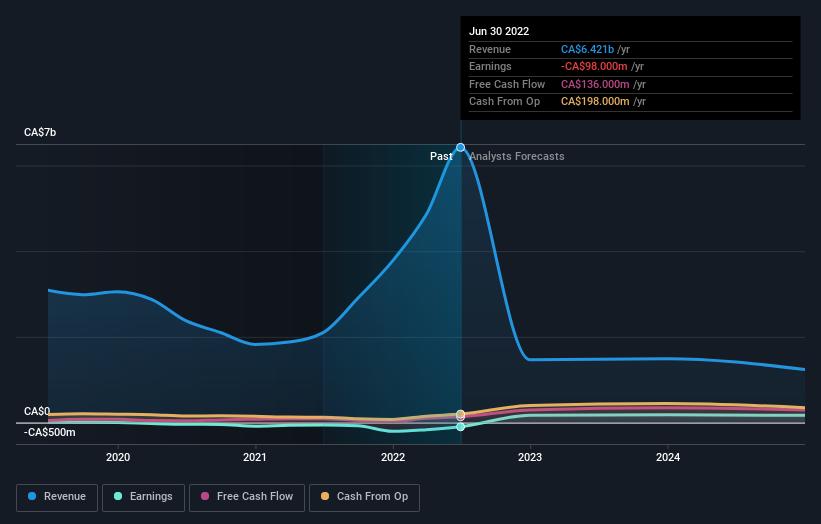
Secure Energy Services already has institutions on the share registry. Indeed, they own a respectable stake in the company. This implies the analysts working for those institutions have looked at the stock and they like it. But just like anyone else, they could be wrong. When multiple institutions own a stock, there's always a risk that they are in a 'crowded trade'. When such a trade goes wrong, multiple parties may compete to sell stock fast. This risk is higher in a company without a history of growth. You can see Secure Energy Services' historic earnings and revenue below, but keep in mind there's always more to the story.
It looks like hedge funds own 27% of Secure Energy Services shares. That worth noting, since hedge funds are often quite active investors, who may try to influence management. Many want to see value creation (and a higher share price) in the short term or medium term. The company's largest shareholder is Angelo, Gordon & Co., L.P., with ownership of 16%. In comparison, the second and third largest shareholders hold about 11% and 5.5% of the stock. Additionally, the company's CEO Rene Amirault directly holds 0.7% of the total shares outstanding.
After doing some more digging, we found that the top 12 have the combined ownership of 51% in the company, suggesting that no single shareholder has significant control over the company.
While it makes sense to study institutional ownership data for a company, it also makes sense to study analyst sentiments to know which way the wind is blowing. Quite a few analysts cover the stock, so you could look into forecast growth quite easily.
Insider Ownership Of Secure Energy Services
The definition of company insiders can be subjective and does vary between jurisdictions. Our data reflects individual insiders, capturing board members at the very least. Company management run the business, but the CEO will answer to the board, even if he or she is a member of it.
I generally consider insider ownership to be a good thing. However, on some occasions it makes it more difficult for other shareholders to hold the board accountable for decisions.
We can see that insiders own shares in Secure Energy Services Inc.. The insiders have a meaningful stake worth CA$31m. Most would see this as a real positive. If you would like to explore the question of insider alignment, you can click here to see if insiders have been buying or selling.
General Public Ownership
The general public, who are usually individual investors, hold a 43% stake in Secure Energy Services. While this size of ownership may not be enough to sway a policy decision in their favour, they can still make a collective impact on company policies.
Next Steps:
It's always worth thinking about the different groups who own shares in a company. But to understand Secure Energy Services better, we need to consider many other factors.
Many find it useful to take an in depth look at how a company has performed in the past. You can access this detailed graph of past earnings, revenue and cash flow.
Ultimately the future is most important. You can access this free report on analyst forecasts for the company.
NB: Figures in this article are calculated using data from the last twelve months, which refer to the 12-month period ending on the last date of the month the financial statement is dated. This may not be consistent with full year annual report figures.
Have feedback on this article? Concerned about the content? Get in touch with us directly. Alternatively, email editorial-team (at) simplywallst.com.
This article by Simply Wall St is general in nature. We provide commentary based on historical data and analyst forecasts only using an unbiased methodology and our articles are not intended to be financial advice. It does not constitute a recommendation to buy or sell any stock, and does not take account of your objectives, or your financial situation. We aim to bring you long-term focused analysis driven by fundamental data. Note that our analysis may not factor in the latest price-sensitive company announcements or qualitative material. Simply Wall St has no position in any stocks mentioned.
Join A Paid User Research Session
You’ll receive a US$30 Amazon Gift card for 1 hour of your time while helping us build better investing tools for the individual investors like yourself. Sign up here
