Institutions own 45% of Broadmark Realty Capital Inc. (NYSE:BRMK) shares but retail investors control 51% of the company
Key Insights
The considerable ownership by retail investors in Broadmark Realty Capital indicates that they collectively have a greater say in management and business strategy
The top 25 shareholders own 41% of the company
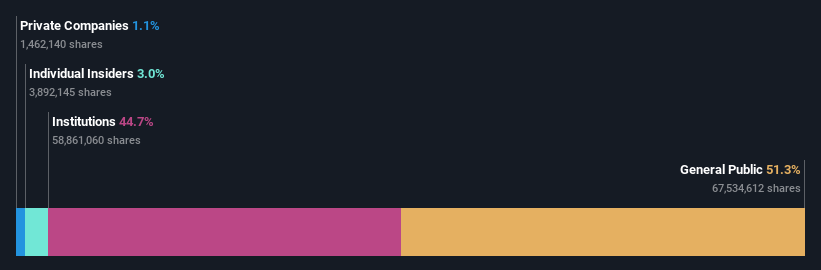
If you want to know who really controls Broadmark Realty Capital Inc. (NYSE:BRMK), then you'll have to look at the makeup of its share registry. The group holding the most number of shares in the company, around 51% to be precise, is retail investors. In other words, the group stands to gain the most (or lose the most) from their investment into the company.
Meanwhile, institutions make up 45% of the company’s shareholders. Insiders often own a large chunk of younger, smaller, companies while huge companies tend to have institutions as shareholders.
Let's take a closer look to see what the different types of shareholders can tell us about Broadmark Realty Capital.
Check out our latest analysis for Broadmark Realty Capital
What Does The Institutional Ownership Tell Us About Broadmark Realty Capital?
Many institutions measure their performance against an index that approximates the local market. So they usually pay more attention to companies that are included in major indices.
We can see that Broadmark Realty Capital does have institutional investors; and they hold a good portion of the company's stock. This implies the analysts working for those institutions have looked at the stock and they like it. But just like anyone else, they could be wrong. If multiple institutions change their view on a stock at the same time, you could see the share price drop fast. It's therefore worth looking at Broadmark Realty Capital's earnings history below. Of course, the future is what really matters.

We note that hedge funds don't have a meaningful investment in Broadmark Realty Capital. The Vanguard Group, Inc. is currently the largest shareholder, with 9.5% of shares outstanding. In comparison, the second and third largest shareholders hold about 8.4% and 3.7% of the stock. Furthermore, CEO Jeffrey Pyatt is the owner of 2.0% of the company's shares.
On studying our ownership data, we found that 25 of the top shareholders collectively own less than 50% of the share register, implying that no single individual has a majority interest.
While it makes sense to study institutional ownership data for a company, it also makes sense to study analyst sentiments to know which way the wind is blowing. Quite a few analysts cover the stock, so you could look into forecast growth quite easily.
Insider Ownership Of Broadmark Realty Capital
The definition of an insider can differ slightly between different countries, but members of the board of directors always count. Management ultimately answers to the board. However, it is not uncommon for managers to be executive board members, especially if they are a founder or the CEO.
Insider ownership is positive when it signals leadership are thinking like the true owners of the company. However, high insider ownership can also give immense power to a small group within the company. This can be negative in some circumstances.
Shareholders would probably be interested to learn that insiders own shares in Broadmark Realty Capital Inc.. As individuals, the insiders collectively own US$20m worth of the US$667m company. This shows at least some alignment. You can click here to see if those insiders have been buying or selling.
General Public Ownership
The general public -- including retail investors -- own 51% of Broadmark Realty Capital. This size of ownership gives investors from the general public some collective power. They can and probably do influence decisions on executive compensation, dividend policies and proposed business acquisitions.
Next Steps:
While it is well worth considering the different groups that own a company, there are other factors that are even more important. Case in point: We've spotted 1 warning sign for Broadmark Realty Capital you should be aware of.
Ultimately the future is most important. You can access this free report on analyst forecasts for the company.
NB: Figures in this article are calculated using data from the last twelve months, which refer to the 12-month period ending on the last date of the month the financial statement is dated. This may not be consistent with full year annual report figures.
Have feedback on this article? Concerned about the content? Get in touch with us directly. Alternatively, email editorial-team (at) simplywallst.com.
This article by Simply Wall St is general in nature. We provide commentary based on historical data and analyst forecasts only using an unbiased methodology and our articles are not intended to be financial advice. It does not constitute a recommendation to buy or sell any stock, and does not take account of your objectives, or your financial situation. We aim to bring you long-term focused analysis driven by fundamental data. Note that our analysis may not factor in the latest price-sensitive company announcements or qualitative material. Simply Wall St has no position in any stocks mentioned.
Join A Paid User Research Session
You’ll receive a US$30 Amazon Gift card for 1 hour of your time while helping us build better investing tools for the individual investors like yourself. Sign up here
