Institutions profited after N4 Pharma Plc's (LON:N4P) market cap rose UK£2.9m last week butindividual investors profited the most
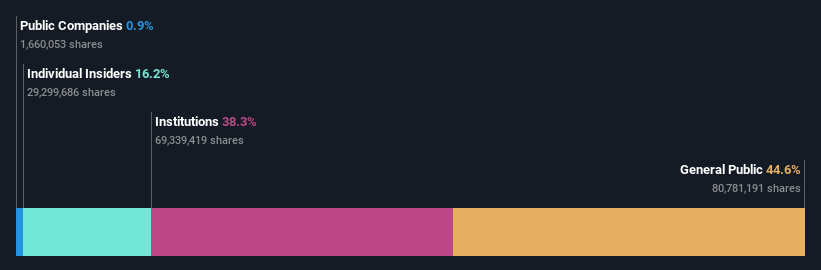
A look at the shareholders of N4 Pharma Plc (LON:N4P) can tell us which group is most powerful. With 45% stake, individual investors possess the maximum shares in the company. Put another way, the group faces the maximum upside potential (or downside risk).
While individual investors were the group that reaped the most benefits after last week’s 80% price gain, institutions also received a 38% cut.
Let's delve deeper into each type of owner of N4 Pharma, beginning with the chart below.
See our latest analysis for N4 Pharma
What Does The Institutional Ownership Tell Us About N4 Pharma?
Institutional investors commonly compare their own returns to the returns of a commonly followed index. So they generally do consider buying larger companies that are included in the relevant benchmark index.
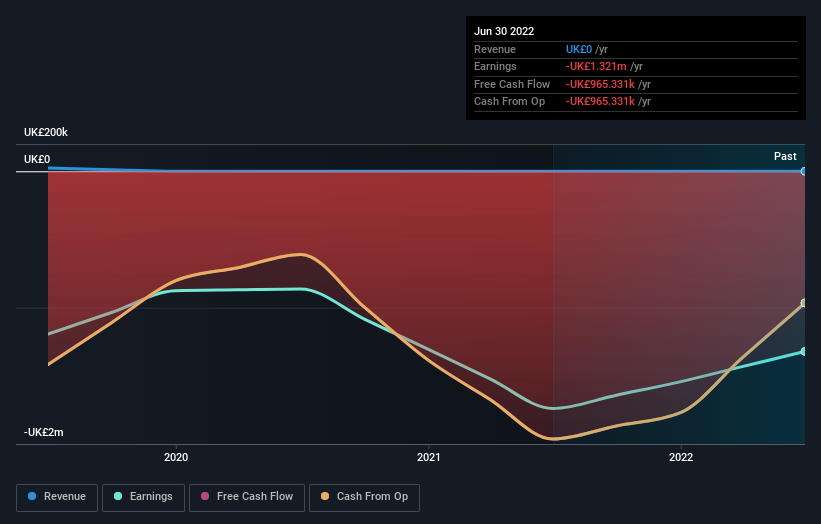
As you can see, institutional investors have a fair amount of stake in N4 Pharma. This implies the analysts working for those institutions have looked at the stock and they like it. But just like anyone else, they could be wrong. When multiple institutions own a stock, there's always a risk that they are in a 'crowded trade'. When such a trade goes wrong, multiple parties may compete to sell stock fast. This risk is higher in a company without a history of growth. You can see N4 Pharma's historic earnings and revenue below, but keep in mind there's always more to the story.
N4 Pharma is not owned by hedge funds. Looking at our data, we can see that the largest shareholder is HBOS Investment Fund Managers Limited with 13% of shares outstanding. With 9.4% and 6.7% of the shares outstanding respectively, Nigel Theobald and David Farrier are the second and third largest shareholders. Nigel Theobald, who is the second-largest shareholder, also happens to hold the title of Chief Executive Officer.
On further inspection, we found that more than half the company's shares are owned by the top 10 shareholders, suggesting that the interests of the larger shareholders are balanced out to an extent by the smaller ones.
While it makes sense to study institutional ownership data for a company, it also makes sense to study analyst sentiments to know which way the wind is blowing. Our information suggests that there isn't any analyst coverage of the stock, so it is probably little known.
Insider Ownership Of N4 Pharma
The definition of an insider can differ slightly between different countries, but members of the board of directors always count. Management ultimately answers to the board. However, it is not uncommon for managers to be executive board members, especially if they are a founder or the CEO.
Insider ownership is positive when it signals leadership are thinking like the true owners of the company. However, high insider ownership can also give immense power to a small group within the company. This can be negative in some circumstances.
Our most recent data indicates that insiders own a reasonable proportion of N4 Pharma Plc. Insiders own UK£105m worth of shares in the UK£652m company. It is great to see insiders so invested in the business. It might be worth checking if those insiders have been buying recently.
General Public Ownership
The general public-- including retail investors -- own 45% stake in the company, and hence can't easily be ignored. This size of ownership, while considerable, may not be enough to change company policy if the decision is not in sync with other large shareholders.
Next Steps:
It's always worth thinking about the different groups who own shares in a company. But to understand N4 Pharma better, we need to consider many other factors. For instance, we've identified 3 warning signs for N4 Pharma that you should be aware of.
Of course this may not be the best stock to buy. Therefore, you may wish to see our free collection of interesting prospects boasting favorable financials.
NB: Figures in this article are calculated using data from the last twelve months, which refer to the 12-month period ending on the last date of the month the financial statement is dated. This may not be consistent with full year annual report figures.
Have feedback on this article? Concerned about the content? Get in touch with us directly. Alternatively, email editorial-team (at) simplywallst.com.
This article by Simply Wall St is general in nature. We provide commentary based on historical data and analyst forecasts only using an unbiased methodology and our articles are not intended to be financial advice. It does not constitute a recommendation to buy or sell any stock, and does not take account of your objectives, or your financial situation. We aim to bring you long-term focused analysis driven by fundamental data. Note that our analysis may not factor in the latest price-sensitive company announcements or qualitative material. Simply Wall St has no position in any stocks mentioned.
Join A Paid User Research Session
You’ll receive a US$30 Amazon Gift card for 1 hour of your time while helping us build better investing tools for the individual investors like yourself. Sign up here
