Interactive Brokers (IBKR) Beats on Q3 Earnings, Stock Slips
Interactive Brokers Group’s IBKR third-quarter 2023 adjusted earnings per share of $1.55 beat the Zacks Consensus Estimate of $1.48. Also, the bottom line reflects a rise of 43.5% from the prior-year quarter.
Results benefited from solid improvement in revenues. Further, the company recorded an increase in customer accounts during the quarter. Also, it had a strong capital position.
However, an increase in expenses and a slight decline in daily average revenue trades (DARTs) were the headwinds. Perhaps due to these concerns, IBKR’s shares tanked 4.3% in after-hour trading following the earnings release.
After considering non-recurring items, net income available to common shareholders (GAAP basis) was $167 million or $1.56 per share, up from $99 million or 97 cents per share in the prior-year quarter. Our estimate for net income was $141.2 million.
Interactive Brokers reported comprehensive income available to common shareholders of $148 million or $1.38 per share compared with $69 million or 68 cents in the prior-year quarter.
Revenues Jump, Expenses Rise
Total GAAP net revenues were $1.15 billion, surging 44.9% year over year. The top line surpassed the Zacks Consensus Estimate of $1.09 billion. Adjusted net revenues were $1.14 billion, up 34.5%.
Total non-interest expenses increased 14.2% to $305 million. The rise was due to an increase in almost all cost components except for customer bad debt expenses.
Income before income taxes was $840 million, jumping 60.6%.
The adjusted pre-tax profit margin was 73%, up from 68% a year ago.
In the reported quarter, total customer DARTs declined 1% year over year to 1.91 million. Total cleared DARTs remained stable at 1.71 million.
Customer accounts grew 21% from the year-ago quarter to 2,431,000.
Capital Position Strong
As of Sep 30, 2023, cash and cash equivalents (including cash and securities set aside for regulatory purposes) totaled $61.5 billion compared with $60.4 billion as of Dec 31, 2022.
As of Sep 30, 2023, total assets were $120.6 billion compared with $115.1 billion as of Dec 31, 2022. Total equity was $13.3 billion, up from $11.6 billion as of Dec 31, 2022.
Our View
Interactive Brokers' efforts to develop proprietary software and an increase in emerging market customers are expected to keep aiding financials. However, increasing expenses will likely hamper the bottom line to an extent in the near term.
Interactive Brokers Group, Inc. Price, Consensus and EPS Surprise
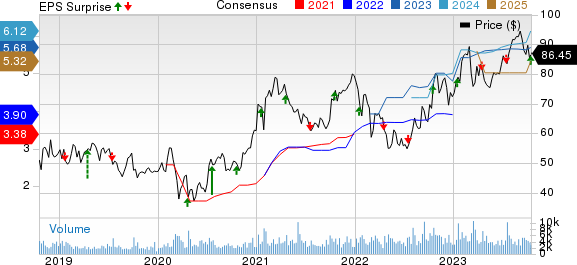
Interactive Brokers Group, Inc. price-consensus-eps-surprise-chart | Interactive Brokers Group, Inc. Quote
Currently, Interactive Brokers carries a Zacks Rank #2 (Buy). You can see the complete list of today’s Zacks #1 Rank (Strong Buy) stocks here.
Performance & Earnings Release Date of Other Investment Brokers
Charles Schwab’s SCHW third-quarter 2023 adjusted earnings of 77 cents per share beat the Zacks Consensus Estimate of 75 cents. The bottom line, however, declined 30% from the prior-year quarter.
Results benefited from the solid performance of the asset management business. The absence of fee waivers and solid brokerage account numbers acted as tailwinds during the quarter. However, lower revenues due to higher funding costs and lower volatility posed a major headwind. SCHW also recorded a rise in expenses.
LPL Financial LPLA is slated to announce third-quarter 2023 numbers on Oct 26.
Over the past 30 days, the Zacks Consensus Estimate for LPL Financial’s quarterly earnings has moved 3.7% lower to $3.63, implying a 16% increase from the prior-year reported number.
Want the latest recommendations from Zacks Investment Research? Today, you can download 7 Best Stocks for the Next 30 Days. Click to get this free report
The Charles Schwab Corporation (SCHW) : Free Stock Analysis Report
Interactive Brokers Group, Inc. (IBKR) : Free Stock Analysis Report
LPL Financial Holdings Inc. (LPLA) : Free Stock Analysis Report
