Intercontinental (ICE) Q4 Earnings & Revenues Beat, Dividend Up
Intercontinental Exchange ICE reported fourth-quarter 2023 adjusted earnings per share of $1.33, which beat the Zacks Consensus Estimate by 3.1%. The bottom line increased 6.4% on a year-over-year basis.
Intercontinental posted solid results in all three segments.
Performance in Detail
Intercontinental’s revenues, less transaction-based expenses, of $2.2 billion decreased 7.4% year over year. The top line beat the Zacks Consensus Estimate by 0.7%.
Intercontinental Exchange Inc. Price, Consensus and EPS Surprise
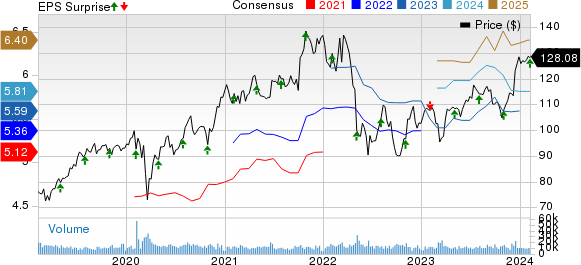
Intercontinental Exchange Inc. price-consensus-eps-surprise-chart | Intercontinental Exchange Inc. Quote
Total operating expenses increased 41.1% year over year to $1.3 billion. This can be primarily attributed to higher compensation and benefits, professional services, acquisition-related transaction and integration costs, technology and communication, rent and occupancy, selling, general and administrative, and depreciation and amortization expense. Our estimate was $1.2 million.
Adjusted operating expenses were $952 million in the quarter, up 28.6% year over year. Our estimate was $965.9 million.
Adjusted operating income rose 21.5% year over year to $1.2 billion. Our estimate was $1.1 billion. The adjusted operating margin contracted 100 basis points (bps) year over year to 57%.
Segment Details
Exchanges' net revenues were $1.1 billion, up 16% year over year. The Zacks Consensus Estimate and our estimate were both pegged at $1.5 billion.
Adjusted operating income of $815 million was up 17.4% year over year. The Zacks Consensus Estimate was pegged at $780 million. Our estimate was $713 million.
Adjusted operating margin expanded 100 basis points year over year to 72%. Our estimate was 65.5%.
Fixed Income and Data Services' revenues were $563 million, which increased 5% year over year. Our estimate was $567 million. The Zacks Consensus Estimate was pegged at $561 million.
Adjusted operating income rose 2.1% to $241 million. The Zacks Consensus Estimate was pegged at $211 million. Our estimate was $117 million.
Adjusted operating margin contracted 100 bps year over year to 43%. Our estimate was 31.3%.
Mortgage Technology’s revenues increased 102% to $502 million. Our estimate was $519 million. The Zacks Consensus Estimate was pegged at $503 million.
Adjusted operating income of $193 million was up 97% year over year. The Zacks Consensus Estimate was pegged at $254 million. Our estimate was $319.2 million.
Adjusted operating margin was flat year over year at 39%. Our estimate was 61.5%.
Full-Year Highlights
Adjusted earnings per share of $5.62 improved 6% year over year and beat the consensus estimate of $5.60.
Net revenues of $8 billion increased 10% and was almost in line with the consensus estimate.
Adjusted operating income of $4.7 billion rose 9% year over year, while adjusted operating margin of 59% remained flat.
Financial Update
As of Dec 31, 2023, Intercontinental had cash and cash equivalents of $1.4 billion, down 82% from Dec 31, 2022. Long-term debt of $20.7 billion increased 14% from 2022-end.
Total equity was $25.8 billion as of Dec 31, 2023, up 13.3% from 2022-end.
The operating cash flow was $3.5 million in 2023, down 0.3% year over year. Adjusted free cash flow was $3.2 million, up 10% year over year.
Intercontinental paid out $955 million in dividends in 2023.
First-Quarter 2024 Guidance
GAAP operating expenses are expected to be $1.175-$1.185 billion. Adjusted operating expenses are projected between $930 million and $940 million.
GAAP non-operating expenses are anticipated between $245 million and $250 million. Adjusted non-operating expenses are anticipated to be $215-$220 million.
Share count is forecast to be 572-578 million.
2024 Guidance
Exchange recurring revenues is suggested to increase in the low-single digits. Fixed Income & Data Services recurring revenues are projected to increase in the mid-single digit. Mortgage Technology revenues are forecast to increase in the low to mid-single digits.
GAAP operating expenses are expected to be $4.775-$4.82 billion. Adjusted operating expenses are envisioned between $3.81 billion and $3.86 billion.
Effective tax rate is projected between 22% and 26%.
Capital expenditure is expected to be $600-$650 million.
Dividend Update
The board of directors approved a 7% increase to the company's dividend to 45 cents per share for the first quarter of 2024. The dividend will be paid out on Mar 29 to shareholders of record as of Mar 14.
Zacks Rank
Intercontinental currently carries a Zacks Rank #3 (Hold). You can see the complete list of today’s Zacks #1 Rank (Strong Buy) stocks here.
Performance of Other Securities and Exchanges
MarketAxess Holdings Inc. MKTX reported strong fourth-quarter 2023 results, aided by higher commissions and trading volumes. Continued solid Eurobonds’ performance further supported its business. The positives were partially offset by an elevated expense level and a lower high-yield credit trading.
Its fourth-quarter 2023 earnings per share of $1.84 beat the Zacks Consensus Estimate by 7%. Moreover, the bottom line increased from $1.58 a year ago.
Total revenues increased 10.9% year over year to $197.2 million in the quarter under review. Also, the top line beat the consensus mark by 0.7%.
Nasdaq NDAQ reported fourth-quarter 2023 adjusted earnings per share of 72 cents, beating the Zacks Consensus Estimate by 2.9%. The bottom line improved 12.5% year over year.
Nasdaq’s revenues of $1.1 billion increased 23% year over year. The top line beat the Zacks Consensus Estimate by 5%.
Annualized Recurring Revenue (ARR) increased 29% year over year. Annualized SaaS revenues increased 23% and represented 35% of ARR. Operating margin of 55% expanded 600 basis points year over year.
Nasdaq expects 2024 non-GAAP operating expenses to be between $2.105 billion and $2.185 billion.
Cboe Global Markets, Inc. CBOE reported fourth-quarter 2023 adjusted earnings of $2.06 per share, which outpaced the Zacks Consensus Estimate by 2%. The bottom line increased 14% year over year. Total adjusted revenues were $499 million, which improved 9% year over year. However, the top line missed the consensus mark by 1.2%.
The adjusted operating margin came in at 61.6%, which expanded 20 bps year over year. The adjusted EBITDA margin of 64.3% expanded 40 bps year over year.
CBOE anticipates organic total net revenue growth of 5-7% in 2024, in line with medium-term organic total net revenue expectations.
Want the latest recommendations from Zacks Investment Research? Today, you can download 7 Best Stocks for the Next 30 Days. Click to get this free report
Intercontinental Exchange Inc. (ICE) : Free Stock Analysis Report
Nasdaq, Inc. (NDAQ) : Free Stock Analysis Report
Cboe Global Markets, Inc. (CBOE) : Free Stock Analysis Report
MarketAxess Holdings Inc. (MKTX) : Free Stock Analysis Report
