Interested In Aptech Limited (NSE:APTECHT)? Here’s How It Performed Recently

After looking at Aptech Limited’s (NSE:APTECHT) latest earnings update (30 June 2018), I found it helpful to revisit the company’s performance in the past couple of years and compare this against the latest numbers. As a long-term investor I tend to focus on earnings trend, rather than a single number at one point in time. Also, comparing it against an industry benchmark to understand whether it outperformed, or is simply riding an industry wave, is an important aspect. In this article I briefly touch on my key findings.
See our latest analysis for Aptech
How Well Did APTECHT Perform?
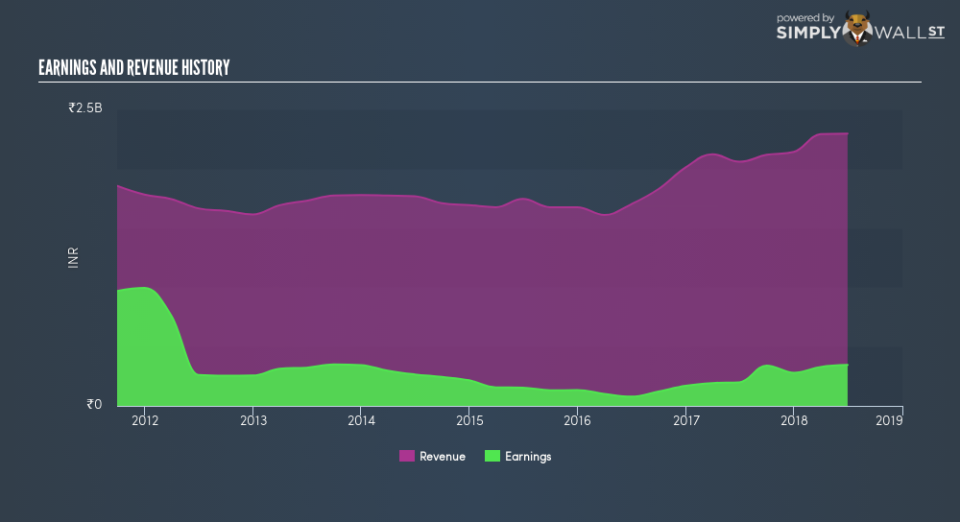
APTECHT’s trailing twelve-month earnings (from 30 June 2018) of ₹345.0m has jumped 73.4% compared to the previous year. Furthermore, this one-year growth rate has exceeded its 5-year annual growth average of -20.4%, indicating the rate at which APTECHT is growing has accelerated. What’s the driver of this growth? Well, let’s take a look at whether it is only attributable to an industry uplift, or if Aptech has seen some company-specific growth.
Over the last couple of years, Aptech top-line expansion has overtaken earnings and the growth rate of expenses. Though this brought about a margin contraction, it has cushioned Aptech’s earnings contraction. Eyeballing growth from a sector-level, the IN consumer services industry has been growing its average earnings by double-digit 23.7% over the previous year, and a more subdued 4.5% over the past half a decade. This growth is a median of profitable companies of 15 Consumer Services companies in IN including Golden Crest Education & Services, Jetking Infotrain and Virtual Global Education. This means that whatever uplift the industry is deriving benefit from, Aptech is able to leverage this to its advantage.
In terms of returns from investment, Aptech has fallen short of achieving a 20% return on equity (ROE), recording 12.4% instead. However, its return on assets (ROA) of 9.7% exceeds the IN Consumer Services industry of 2.9%, indicating Aptech has used its assets more efficiently. And finally, its return on capital (ROC), which also accounts for Aptech’s debt level, has increased over the past 3 years from 6.8% to 7.4%.
What does this mean?
Though Aptech’s past data is helpful, it is only one aspect of my investment thesis. While Aptech has a good historical track record with positive growth and profitability, there’s no certainty that this will extrapolate into the future. I suggest you continue to research Aptech to get a better picture of the stock by looking at:
Future Outlook: What are well-informed industry analysts predicting for APTECHT’s future growth? Take a look at our free research report of analyst consensus for APTECHT’s outlook.
Financial Health: Are APTECHT’s operations financially sustainable? Balance sheets can be hard to analyze, which is why we’ve done it for you. Check out our financial health checks here.
Other High-Performing Stocks: Are there other stocks that provide better prospects with proven track records? Explore our free list of these great stocks here.
NB: Figures in this article are calculated using data from the trailing twelve months from 30 June 2018. This may not be consistent with full year annual report figures.
To help readers see past the short term volatility of the financial market, we aim to bring you a long-term focused research analysis purely driven by fundamental data. Note that our analysis does not factor in the latest price-sensitive company announcements.
The author is an independent contributor and at the time of publication had no position in the stocks mentioned. For errors that warrant correction please contact the editor at editorial-team@simplywallst.com.
