Investing in Kandi Technologies Group (NASDAQ:KNDI) a year ago would have delivered you a 58% gain
These days it's easy to simply buy an index fund, and your returns should (roughly) match the market. But you can significantly boost your returns by picking above-average stocks. To wit, the Kandi Technologies Group, Inc. (NASDAQ:KNDI) share price is 58% higher than it was a year ago, much better than the market return of around 4.2% (not including dividends) in the same period. If it can keep that out-performance up over the long term, investors will do very well! Zooming out, the stock is actually down 58% in the last three years.
So let's assess the underlying fundamentals over the last 1 year and see if they've moved in lock-step with shareholder returns.
See our latest analysis for Kandi Technologies Group
Kandi Technologies Group isn't currently profitable, so most analysts would look to revenue growth to get an idea of how fast the underlying business is growing. When a company doesn't make profits, we'd generally expect to see good revenue growth. That's because it's hard to be confident a company will be sustainable if revenue growth is negligible, and it never makes a profit.
Over the last twelve months, Kandi Technologies Group's revenue grew by 43%. That's a fairly respectable growth rate. While the share price performed well, gaining 58% over twelve months, you could argue the revenue growth warranted it. If the company can maintain the revenue growth, the share price could go higher still. But it's crucial to check profitability and cash flow before forming a view on the future.
The company's revenue and earnings (over time) are depicted in the image below (click to see the exact numbers).
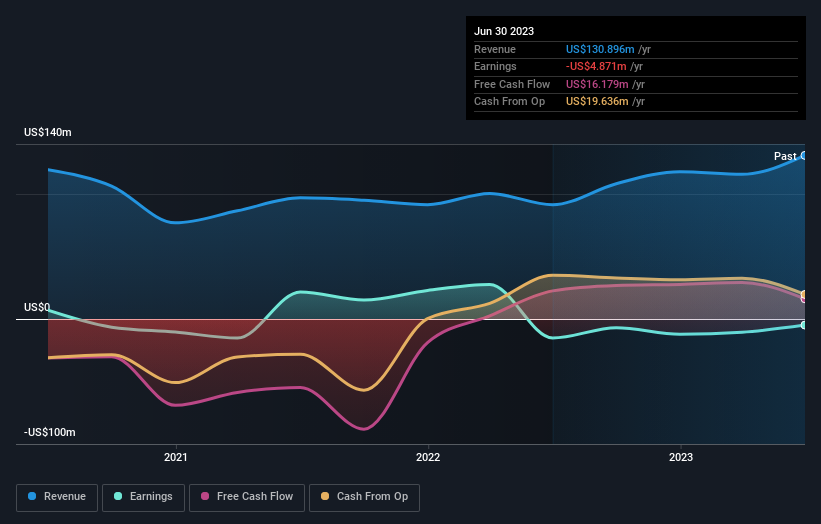
It's probably worth noting that the CEO is paid less than the median at similar sized companies. It's always worth keeping an eye on CEO pay, but a more important question is whether the company will grow earnings throughout the years. Dive deeper into the earnings by checking this interactive graph of Kandi Technologies Group's earnings, revenue and cash flow.
A Different Perspective
We're pleased to report that Kandi Technologies Group shareholders have received a total shareholder return of 58% over one year. That certainly beats the loss of about 1.7% per year over the last half decade. We generally put more weight on the long term performance over the short term, but the recent improvement could hint at a (positive) inflection point within the business. You could get a better understanding of Kandi Technologies Group's growth by checking out this more detailed historical graph of earnings, revenue and cash flow.
For those who like to find winning investments this free list of growing companies with recent insider purchasing, could be just the ticket.
Please note, the market returns quoted in this article reflect the market weighted average returns of stocks that currently trade on American exchanges.
Have feedback on this article? Concerned about the content? Get in touch with us directly. Alternatively, email editorial-team (at) simplywallst.com.
This article by Simply Wall St is general in nature. We provide commentary based on historical data and analyst forecasts only using an unbiased methodology and our articles are not intended to be financial advice. It does not constitute a recommendation to buy or sell any stock, and does not take account of your objectives, or your financial situation. We aim to bring you long-term focused analysis driven by fundamental data. Note that our analysis may not factor in the latest price-sensitive company announcements or qualitative material. Simply Wall St has no position in any stocks mentioned.
