Investing in Red Rock Resorts (NASDAQ:RRR) five years ago would have delivered you a 133% gain
When we invest, we're generally looking for stocks that outperform the market average. And the truth is, you can make significant gains if you buy good quality businesses at the right price. For example, long term Red Rock Resorts, Inc. (NASDAQ:RRR) shareholders have enjoyed a 99% share price rise over the last half decade, well in excess of the market return of around 68% (not including dividends). However, more recent returns haven't been as impressive as that, with the stock returning just 8.1% in the last year , including dividends .
Now it's worth having a look at the company's fundamentals too, because that will help us determine if the long term shareholder return has matched the performance of the underlying business.
See our latest analysis for Red Rock Resorts
In his essay The Superinvestors of Graham-and-Doddsville Warren Buffett described how share prices do not always rationally reflect the value of a business. One flawed but reasonable way to assess how sentiment around a company has changed is to compare the earnings per share (EPS) with the share price.
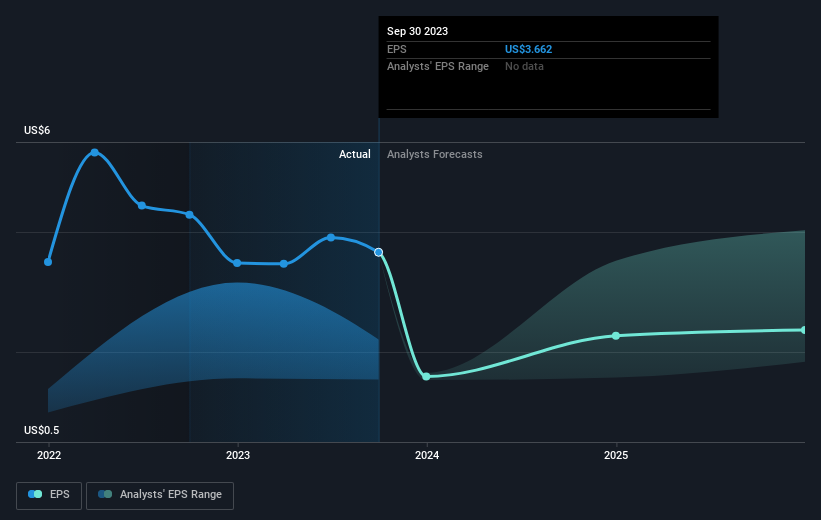
During the five years of share price growth, Red Rock Resorts moved from a loss to profitability. That's generally thought to be a genuine positive, so we would expect to see an increasing share price.
You can see below how EPS has changed over time (discover the exact values by clicking on the image).
It's probably worth noting that the CEO is paid less than the median at similar sized companies. It's always worth keeping an eye on CEO pay, but a more important question is whether the company will grow earnings throughout the years. This free interactive report on Red Rock Resorts' earnings, revenue and cash flow is a great place to start, if you want to investigate the stock further.
What About Dividends?
As well as measuring the share price return, investors should also consider the total shareholder return (TSR). The TSR is a return calculation that accounts for the value of cash dividends (assuming that any dividend received was reinvested) and the calculated value of any discounted capital raisings and spin-offs. So for companies that pay a generous dividend, the TSR is often a lot higher than the share price return. We note that for Red Rock Resorts the TSR over the last 5 years was 133%, which is better than the share price return mentioned above. This is largely a result of its dividend payments!
A Different Perspective
Red Rock Resorts shareholders are up 8.1% for the year (even including dividends). Unfortunately this falls short of the market return. If we look back over five years, the returns are even better, coming in at 18% per year for five years. It's quite possible the business continues to execute with prowess, even as the share price gains are slowing. While it is well worth considering the different impacts that market conditions can have on the share price, there are other factors that are even more important. Take risks, for example - Red Rock Resorts has 2 warning signs (and 1 which makes us a bit uncomfortable) we think you should know about.
For those who like to find winning investments this free list of growing companies with recent insider purchasing, could be just the ticket.
Please note, the market returns quoted in this article reflect the market weighted average returns of stocks that currently trade on American exchanges.
Have feedback on this article? Concerned about the content? Get in touch with us directly. Alternatively, email editorial-team (at) simplywallst.com.
This article by Simply Wall St is general in nature. We provide commentary based on historical data and analyst forecasts only using an unbiased methodology and our articles are not intended to be financial advice. It does not constitute a recommendation to buy or sell any stock, and does not take account of your objectives, or your financial situation. We aim to bring you long-term focused analysis driven by fundamental data. Note that our analysis may not factor in the latest price-sensitive company announcements or qualitative material. Simply Wall St has no position in any stocks mentioned.
