Investing in Rentokil Initial (LON:RTO) five years ago would have delivered you a 89% gain
When we invest, we're generally looking for stocks that outperform the market average. And while active stock picking involves risks (and requires diversification) it can also provide excess returns. For example, the Rentokil Initial plc (LON:RTO) share price is up 80% in the last 5 years, clearly besting the market decline of around 7.9% (ignoring dividends). On the other hand, the more recent gains haven't been so impressive, with shareholders gaining just 28% , including dividends .
With that in mind, it's worth seeing if the company's underlying fundamentals have been the driver of long term performance, or if there are some discrepancies.
See our latest analysis for Rentokil Initial
In his essay The Superinvestors of Graham-and-Doddsville Warren Buffett described how share prices do not always rationally reflect the value of a business. One imperfect but simple way to consider how the market perception of a company has shifted is to compare the change in the earnings per share (EPS) with the share price movement.
During five years of share price growth, Rentokil Initial actually saw its EPS drop 24% per year.
Essentially, it doesn't seem likely that investors are focused on EPS. Since the change in EPS doesn't seem to correlate with the change in share price, it's worth taking a look at other metrics.
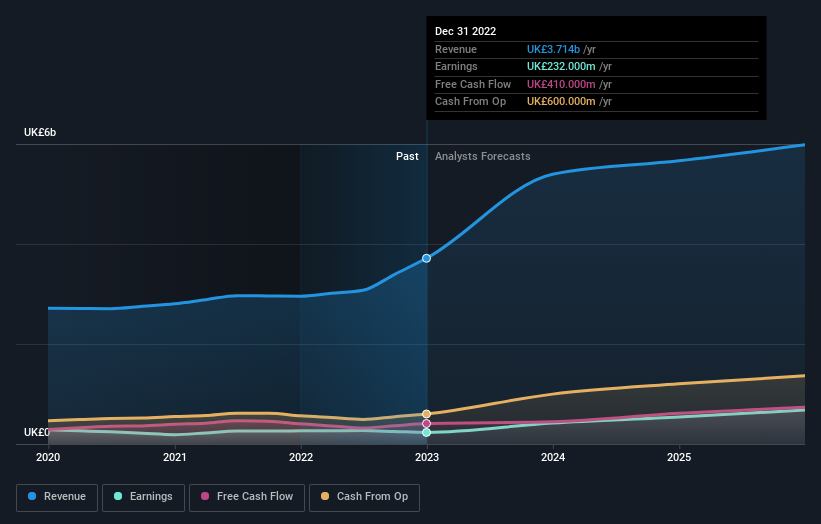
We doubt the modest 1.2% dividend yield is attracting many buyers to the stock. On the other hand, Rentokil Initial's revenue is growing nicely, at a compound rate of 7.4% over the last five years. In that case, the company may be sacrificing current earnings per share to drive growth.
The image below shows how earnings and revenue have tracked over time (if you click on the image you can see greater detail).
Rentokil Initial is well known by investors, and plenty of clever analysts have tried to predict the future profit levels. Given we have quite a good number of analyst forecasts, it might be well worth checking out this free chart depicting consensus estimates.
What About Dividends?
When looking at investment returns, it is important to consider the difference between total shareholder return (TSR) and share price return. Whereas the share price return only reflects the change in the share price, the TSR includes the value of dividends (assuming they were reinvested) and the benefit of any discounted capital raising or spin-off. Arguably, the TSR gives a more comprehensive picture of the return generated by a stock. As it happens, Rentokil Initial's TSR for the last 5 years was 89%, which exceeds the share price return mentioned earlier. This is largely a result of its dividend payments!
A Different Perspective
We're pleased to report that Rentokil Initial shareholders have received a total shareholder return of 28% over one year. And that does include the dividend. That gain is better than the annual TSR over five years, which is 14%. Therefore it seems like sentiment around the company has been positive lately. Given the share price momentum remains strong, it might be worth taking a closer look at the stock, lest you miss an opportunity. While it is well worth considering the different impacts that market conditions can have on the share price, there are other factors that are even more important. To that end, you should learn about the 3 warning signs we've spotted with Rentokil Initial (including 1 which is significant) .
Of course, you might find a fantastic investment by looking elsewhere. So take a peek at this free list of companies we expect will grow earnings.
Please note, the market returns quoted in this article reflect the market weighted average returns of stocks that currently trade on British exchanges.
Have feedback on this article? Concerned about the content? Get in touch with us directly. Alternatively, email editorial-team (at) simplywallst.com.
This article by Simply Wall St is general in nature. We provide commentary based on historical data and analyst forecasts only using an unbiased methodology and our articles are not intended to be financial advice. It does not constitute a recommendation to buy or sell any stock, and does not take account of your objectives, or your financial situation. We aim to bring you long-term focused analysis driven by fundamental data. Note that our analysis may not factor in the latest price-sensitive company announcements or qualitative material. Simply Wall St has no position in any stocks mentioned.
Join A Paid User Research Session
You’ll receive a US$30 Amazon Gift card for 1 hour of your time while helping us build better investing tools for the individual investors like yourself. Sign up here
