Investing in Stryker (NYSE:SYK) five years ago would have delivered you a 95% gain
If you want to compound wealth in the stock market, you can do so by buying an index fund. But the truth is, you can make significant gains if you buy good quality businesses at the right price. For example, the Stryker Corporation (NYSE:SYK) share price is up 85% in the last five years, slightly above the market return. It's also good to see a healthy gain of 33% in the last year.
Now it's worth having a look at the company's fundamentals too, because that will help us determine if the long term shareholder return has matched the performance of the underlying business.
View our latest analysis for Stryker
In his essay The Superinvestors of Graham-and-Doddsville Warren Buffett described how share prices do not always rationally reflect the value of a business. One way to examine how market sentiment has changed over time is to look at the interaction between a company's share price and its earnings per share (EPS).
Stryker's earnings per share are down 2.6% per year, despite strong share price performance over five years.
By glancing at these numbers, we'd posit that the decline in earnings per share is not representative of how the business has changed over the years. Therefore, it's worth taking a look at other metrics to try to understand the share price movements.
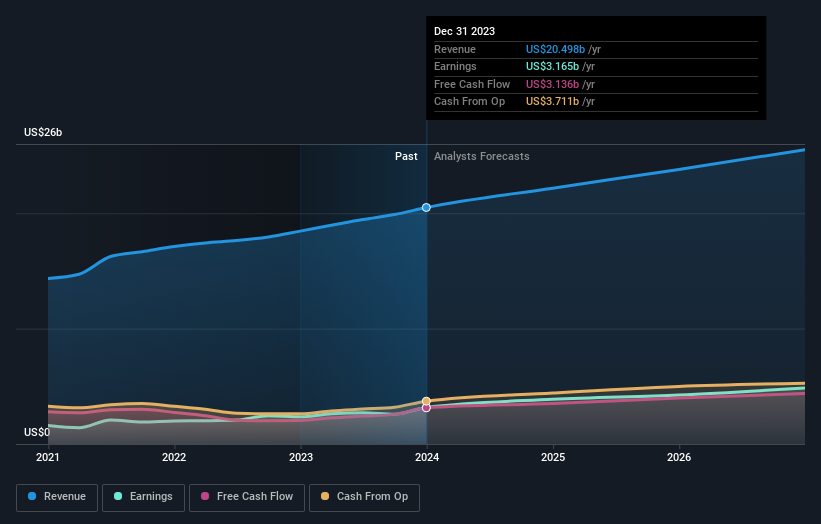
The modest 0.9% dividend yield is unlikely to be propping up the share price. On the other hand, Stryker's revenue is growing nicely, at a compound rate of 8.4% over the last five years. It's quite possible that management are prioritizing revenue growth over EPS growth at the moment.
The graphic below depicts how earnings and revenue have changed over time (unveil the exact values by clicking on the image).
Stryker is well known by investors, and plenty of clever analysts have tried to predict the future profit levels. If you are thinking of buying or selling Stryker stock, you should check out this free report showing analyst consensus estimates for future profits.
What About Dividends?
It is important to consider the total shareholder return, as well as the share price return, for any given stock. Whereas the share price return only reflects the change in the share price, the TSR includes the value of dividends (assuming they were reinvested) and the benefit of any discounted capital raising or spin-off. Arguably, the TSR gives a more comprehensive picture of the return generated by a stock. As it happens, Stryker's TSR for the last 5 years was 95%, which exceeds the share price return mentioned earlier. The dividends paid by the company have thusly boosted the total shareholder return.
A Different Perspective
We're pleased to report that Stryker shareholders have received a total shareholder return of 35% over one year. That's including the dividend. That's better than the annualised return of 14% over half a decade, implying that the company is doing better recently. Someone with an optimistic perspective could view the recent improvement in TSR as indicating that the business itself is getting better with time. I find it very interesting to look at share price over the long term as a proxy for business performance. But to truly gain insight, we need to consider other information, too. To that end, you should be aware of the 2 warning signs we've spotted with Stryker .
If you like to buy stocks alongside management, then you might just love this free list of companies. (Hint: insiders have been buying them).
Please note, the market returns quoted in this article reflect the market weighted average returns of stocks that currently trade on American exchanges.
Have feedback on this article? Concerned about the content? Get in touch with us directly. Alternatively, email editorial-team (at) simplywallst.com.
This article by Simply Wall St is general in nature. We provide commentary based on historical data and analyst forecasts only using an unbiased methodology and our articles are not intended to be financial advice. It does not constitute a recommendation to buy or sell any stock, and does not take account of your objectives, or your financial situation. We aim to bring you long-term focused analysis driven by fundamental data. Note that our analysis may not factor in the latest price-sensitive company announcements or qualitative material. Simply Wall St has no position in any stocks mentioned.
