Investing in Tandem Diabetes Care (TNDM): Navigating the Thin Line Between Value and Trap
Value-focused investors are always on the hunt for stocks that are priced below their intrinsic value. One such stock that merits attention is Tandem Diabetes Care Inc (NASDAQ:TNDM). The stock, which is currently priced at $21.82, recorded a gain of 5.06% in a day and a 3-month decrease of 10.8%. The stock's fair valuation is $125.44, as indicated by its GF Value.
Understanding the GF Value
The GF Value represents the current intrinsic value of a stock derived from our exclusive method. The GF Value Line on our summary page gives an overview of the fair value that the stock should be traded at. It is calculated based on three factors: historical multiples (PE Ratio, PS Ratio, PB Ratio and Price-to-Free-Cash-Flow) that the stock has traded at, GuruFocus adjustment factor based on the company's past returns and growth, and future estimates of the business performance.
We believe the GF Value Line is the fair value that the stock should be traded at. The stock price will most likely fluctuate around the GF Value Line. If the stock price is significantly above the GF Value Line, it is overvalued and its future return is likely to be poor. On the other hand, if it is significantly below the GF Value Line, its future return will likely be higher.
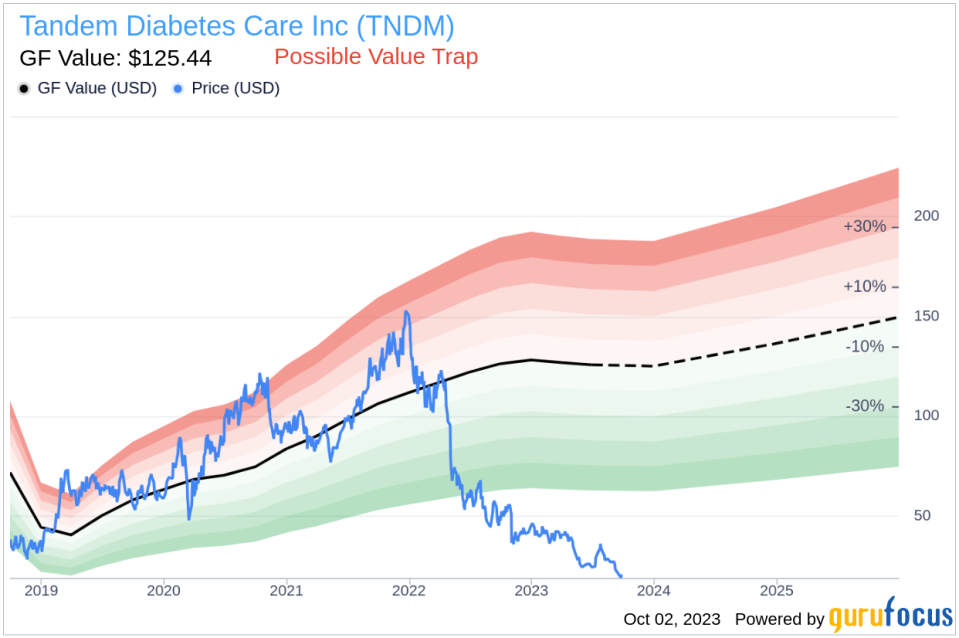
However, investors need to consider a more in-depth analysis before making an investment decision. Despite its seemingly attractive valuation, certain risk factors associated with Tandem Diabetes Care should not be ignored. These risks are primarily reflected through its low Altman Z-score of 0.83. These indicators suggest that Tandem Diabetes Care, despite its apparent undervaluation, might be a potential value trap. This complexity underlines the importance of thorough due diligence in investment decision-making.
Understanding the Altman Z-Score
Before delving into the details, let's understand what the Altman Z-score entails. Invented by New York University Professor Edward I. Altman in 1968, the Z-Score is a financial model that predicts the probability of a company entering bankruptcy within a two-year time frame. The Altman Z-Score combines five different financial ratios, each weighted to create a final score. A score below 1.8 suggests a high likelihood of financial distress, while a score above 3 indicates a low risk.
Introduction to Tandem Diabetes Care Inc
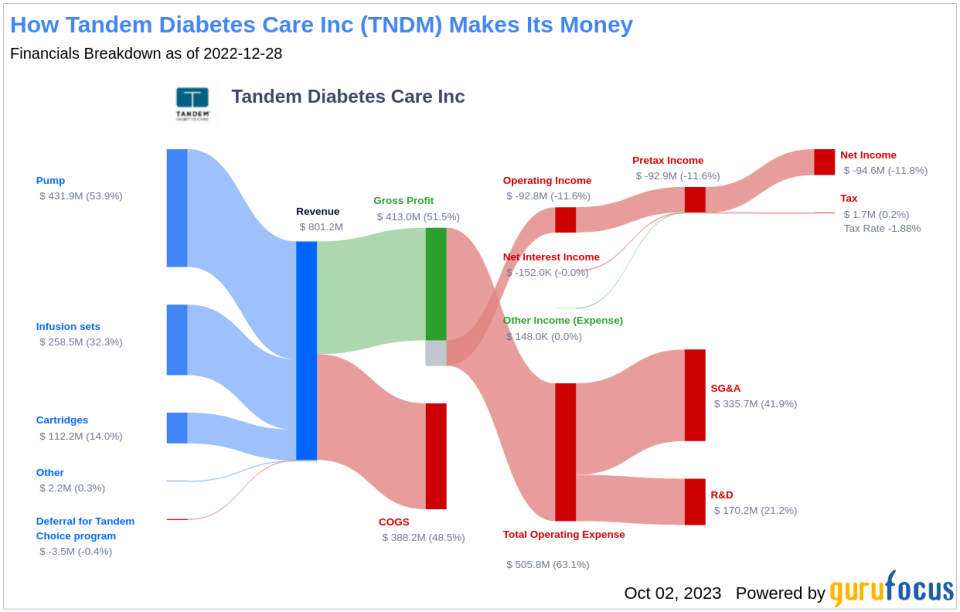
Tandem Diabetes Care designs, manufactures, and markets durable insulin pumps for diabetes patients. The firm first entered this market in 2012 and has since introduced multiple generations of pumps leading to its current t:slim X2 device. Nearly three quarters of total revenue is derived from the U.S., with the remainder primarily from other developed nations. The pumps themselves generate just over half of total sales, and another one third is from disposable infusion sets that need to be changed over every 2 to 3 days.
Breaking Down Tandem Diabetes Care's Low Altman Z-Score
A dissection of Tandem Diabetes Care's Altman Z-score reveals Tandem Diabetes Care's financial health may be weak, suggesting possible financial distress.
The EBIT to Total Assets ratio serves as a crucial barometer of a company's operational effectiveness, correlating earnings before interest and taxes (EBIT) to total assets. An analysis of Tandem Diabetes Care's EBIT to Total Assets ratio from historical data (2021: 0.02; 2022: -0.01; 2023: -0.23) indicates a descending trend. This reduction suggests that Tandem Diabetes Care might not be utilizing its assets to their full potential to generate operational profits, which could be negatively affecting the company's overall Z-score.
When it comes to operational efficiency, a vital indicator for Tandem Diabetes Care is its asset turnover. The data: 2021: 0.85; 2022: 0.83; 2023: 0.78 from the past three years suggests a decreasing trend in this ratio. The asset turnover ratio reflects how effectively a company is using its assets to generate sales. Therefore, a drop in this ratio can signify reduced operational efficiency, potentially due to underutilization of assets or decreased market demand for the company's products or services. This shift in Tandem Diabetes Care's asset turnover underlines the need for the company to reassess its operational strategies to optimize asset usage and boost sales.
Concluding Thoughts: The Value Trap Dilemma
Despite Tandem Diabetes Care's seemingly attractive valuation, the company's low Altman Z-score and declining operational efficiency suggest potential financial distress. These factors, coupled with the stock's current price significantly below its GF Value, indicate that Tandem Diabetes Care might be a potential value trap. It is crucial for investors to conduct thorough due diligence and consider these risk factors before making an investment decision.
GuruFocus Premium members can find stocks with high Altman Z-Score using the following Screener: Walter Schloss Screen .
This article first appeared on GuruFocus.
