Investors in Bank of N.T. Butterfield & Son (NYSE:NTB) have seen returns of 10% over the past five years
While not a mind-blowing move, it is good to see that the The Bank of N.T. Butterfield & Son Limited (NYSE:NTB) share price has gained 11% in the last three months. But over the last half decade, the stock has not performed well. You would have done a lot better buying an index fund, since the stock has dropped 17% in that half decade.
With that in mind, it's worth seeing if the company's underlying fundamentals have been the driver of long term performance, or if there are some discrepancies.
Check out our latest analysis for Bank of N.T. Butterfield & Son
To paraphrase Benjamin Graham: Over the short term the market is a voting machine, but over the long term it's a weighing machine. One flawed but reasonable way to assess how sentiment around a company has changed is to compare the earnings per share (EPS) with the share price.
During the unfortunate half decade during which the share price slipped, Bank of N.T. Butterfield & Son actually saw its earnings per share (EPS) improve by 7.8% per year. So it doesn't seem like EPS is a great guide to understanding how the market is valuing the stock. Alternatively, growth expectations may have been unreasonable in the past.
It's strange to see such muted share price performance despite sustained growth. Perhaps a clue lies in other metrics.
The steady dividend doesn't really explain why the share price is down. While it's not completely obvious why the share price is down, a closer look at the company's history might help explain it.
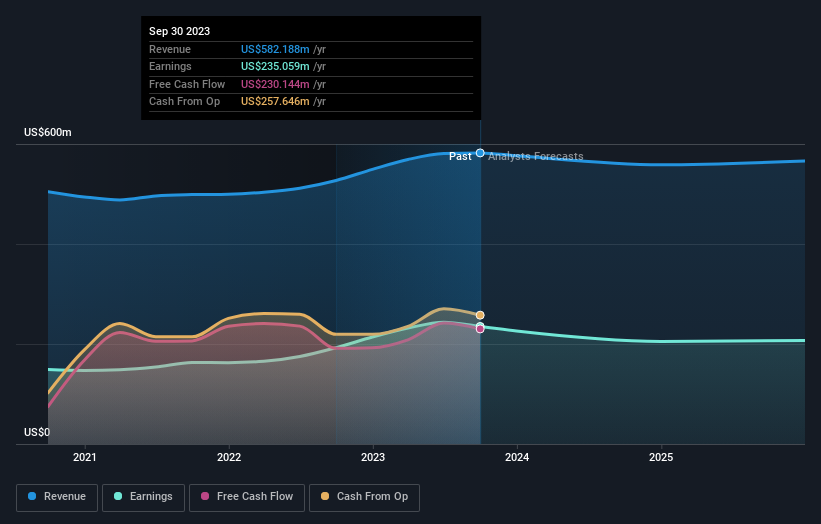
You can see how earnings and revenue have changed over time in the image below (click on the chart to see the exact values).
We know that Bank of N.T. Butterfield & Son has improved its bottom line lately, but what does the future have in store? If you are thinking of buying or selling Bank of N.T. Butterfield & Son stock, you should check out this free report showing analyst profit forecasts.
What About Dividends?
When looking at investment returns, it is important to consider the difference between total shareholder return (TSR) and share price return. Whereas the share price return only reflects the change in the share price, the TSR includes the value of dividends (assuming they were reinvested) and the benefit of any discounted capital raising or spin-off. It's fair to say that the TSR gives a more complete picture for stocks that pay a dividend. As it happens, Bank of N.T. Butterfield & Son's TSR for the last 5 years was 10%, which exceeds the share price return mentioned earlier. And there's no prize for guessing that the dividend payments largely explain the divergence!
A Different Perspective
While the broader market gained around 22% in the last year, Bank of N.T. Butterfield & Son shareholders lost 4.7% (even including dividends). Even the share prices of good stocks drop sometimes, but we want to see improvements in the fundamental metrics of a business, before getting too interested. On the bright side, long term shareholders have made money, with a gain of 2% per year over half a decade. It could be that the recent sell-off is an opportunity, so it may be worth checking the fundamental data for signs of a long term growth trend. I find it very interesting to look at share price over the long term as a proxy for business performance. But to truly gain insight, we need to consider other information, too. Case in point: We've spotted 2 warning signs for Bank of N.T. Butterfield & Son you should be aware of, and 1 of them is potentially serious.
Of course Bank of N.T. Butterfield & Son may not be the best stock to buy. So you may wish to see this free collection of growth stocks.
Please note, the market returns quoted in this article reflect the market weighted average returns of stocks that currently trade on American exchanges.
Have feedback on this article? Concerned about the content? Get in touch with us directly. Alternatively, email editorial-team (at) simplywallst.com.
This article by Simply Wall St is general in nature. We provide commentary based on historical data and analyst forecasts only using an unbiased methodology and our articles are not intended to be financial advice. It does not constitute a recommendation to buy or sell any stock, and does not take account of your objectives, or your financial situation. We aim to bring you long-term focused analysis driven by fundamental data. Note that our analysis may not factor in the latest price-sensitive company announcements or qualitative material. Simply Wall St has no position in any stocks mentioned.
