Investors in Canfor (TSE:CFP) from three years ago are still down 34%, even after 6.0% gain this past week
For many investors, the main point of stock picking is to generate higher returns than the overall market. But if you try your hand at stock picking, your risk returning less than the market. We regret to report that long term Canfor Corporation (TSE:CFP) shareholders have had that experience, with the share price dropping 34% in three years, versus a market return of about 24%. But it's up 6.0% in the last week.
While the last three years has been tough for Canfor shareholders, this past week has shown signs of promise. So let's look at the longer term fundamentals and see if they've been the driver of the negative returns.
Check out our latest analysis for Canfor
To quote Buffett, 'Ships will sail around the world but the Flat Earth Society will flourish. There will continue to be wide discrepancies between price and value in the marketplace...' One flawed but reasonable way to assess how sentiment around a company has changed is to compare the earnings per share (EPS) with the share price.
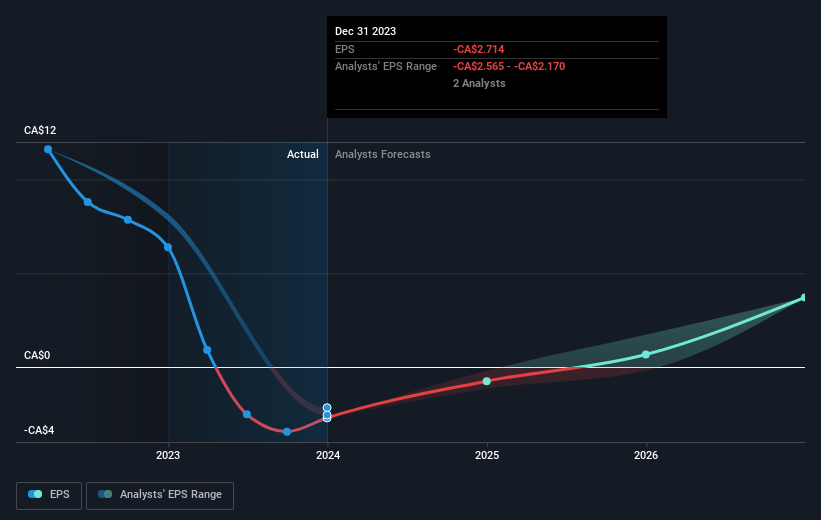
Canfor saw its share price decline over the three years in which its EPS also dropped, falling to a loss. Due to the loss, it's not easy to use EPS as a reliable guide to the business. But it's safe to say we'd generally expect the share price to be lower as a result!
The company's earnings per share (over time) is depicted in the image below (click to see the exact numbers).
Before buying or selling a stock, we always recommend a close examination of historic growth trends, available here.
A Different Perspective
Investors in Canfor had a tough year, with a total loss of 20%, against a market gain of about 13%. However, keep in mind that even the best stocks will sometimes underperform the market over a twelve month period. Longer term investors wouldn't be so upset, since they would have made 4%, each year, over five years. It could be that the recent sell-off is an opportunity, so it may be worth checking the fundamental data for signs of a long term growth trend. You could get a better understanding of Canfor's growth by checking out this more detailed historical graph of earnings, revenue and cash flow.
If you would prefer to check out another company -- one with potentially superior financials -- then do not miss this free list of companies that have proven they can grow earnings.
Please note, the market returns quoted in this article reflect the market weighted average returns of stocks that currently trade on Canadian exchanges.
Have feedback on this article? Concerned about the content? Get in touch with us directly. Alternatively, email editorial-team (at) simplywallst.com.
This article by Simply Wall St is general in nature. We provide commentary based on historical data and analyst forecasts only using an unbiased methodology and our articles are not intended to be financial advice. It does not constitute a recommendation to buy or sell any stock, and does not take account of your objectives, or your financial situation. We aim to bring you long-term focused analysis driven by fundamental data. Note that our analysis may not factor in the latest price-sensitive company announcements or qualitative material. Simply Wall St has no position in any stocks mentioned.
