Investors in DHI Group (NYSE:DHX) have unfortunately lost 32% over the last year
The simplest way to benefit from a rising market is to buy an index fund. Active investors aim to buy stocks that vastly outperform the market - but in the process, they risk under-performance. Unfortunately the DHI Group, Inc. (NYSE:DHX) share price slid 32% over twelve months. That falls noticeably short of the market return of around 32%. Longer term shareholders haven't suffered as badly, since the stock is down a comparatively less painful 22% in three years. Contrary to the longer term story, the last month has been good for stockholders, with a share price gain of 8.4%.
It's worthwhile assessing if the company's economics have been moving in lockstep with these underwhelming shareholder returns, or if there is some disparity between the two. So let's do just that.
View our latest analysis for DHI Group
To paraphrase Benjamin Graham: Over the short term the market is a voting machine, but over the long term it's a weighing machine. One imperfect but simple way to consider how the market perception of a company has shifted is to compare the change in the earnings per share (EPS) with the share price movement.
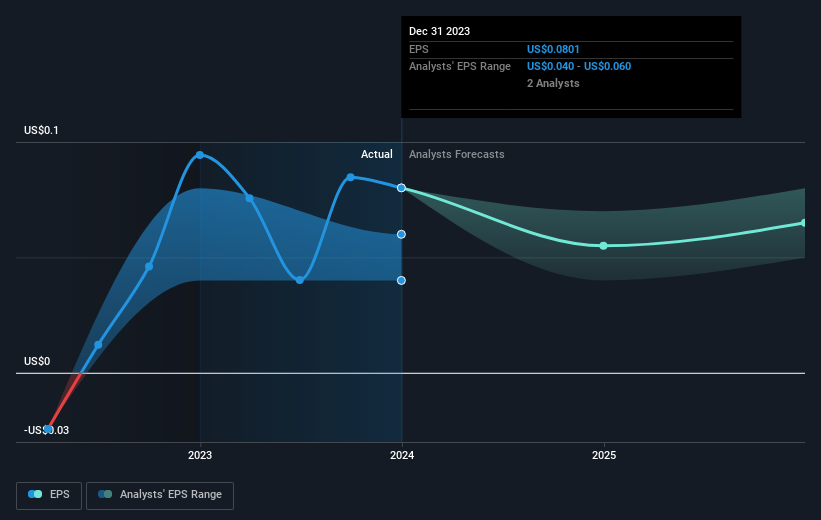
Unhappily, DHI Group had to report a 15% decline in EPS over the last year. The share price decline of 32% is actually more than the EPS drop. So it seems the market was too confident about the business, a year ago.
You can see below how EPS has changed over time (discover the exact values by clicking on the image).
It is of course excellent to see how DHI Group has grown profits over the years, but the future is more important for shareholders. This free interactive report on DHI Group's balance sheet strength is a great place to start, if you want to investigate the stock further.
A Different Perspective
DHI Group shareholders are down 32% for the year, but the market itself is up 32%. Even the share prices of good stocks drop sometimes, but we want to see improvements in the fundamental metrics of a business, before getting too interested. On the bright side, long term shareholders have made money, with a gain of 0.6% per year over half a decade. It could be that the recent sell-off is an opportunity, so it may be worth checking the fundamental data for signs of a long term growth trend. I find it very interesting to look at share price over the long term as a proxy for business performance. But to truly gain insight, we need to consider other information, too. Take risks, for example - DHI Group has 3 warning signs (and 1 which is significant) we think you should know about.
Of course DHI Group may not be the best stock to buy. So you may wish to see this free collection of growth stocks.
Please note, the market returns quoted in this article reflect the market weighted average returns of stocks that currently trade on American exchanges.
Have feedback on this article? Concerned about the content? Get in touch with us directly. Alternatively, email editorial-team (at) simplywallst.com.
This article by Simply Wall St is general in nature. We provide commentary based on historical data and analyst forecasts only using an unbiased methodology and our articles are not intended to be financial advice. It does not constitute a recommendation to buy or sell any stock, and does not take account of your objectives, or your financial situation. We aim to bring you long-term focused analysis driven by fundamental data. Note that our analysis may not factor in the latest price-sensitive company announcements or qualitative material. Simply Wall St has no position in any stocks mentioned.
