Investors in DoubleDown Interactive (NASDAQ:DDI) have unfortunately lost 15% over the last year
DoubleDown Interactive Co., Ltd. (NASDAQ:DDI) shareholders should be happy to see the share price up 12% in the last quarter. But that doesn't change the fact that the returns over the last year have been less than pleasing. In fact, the price has declined 15% in a year, falling short of the returns you could get by investing in an index fund.
Now let's have a look at the company's fundamentals, and see if the long term shareholder return has matched the performance of the underlying business.
See our latest analysis for DoubleDown Interactive
While markets are a powerful pricing mechanism, share prices reflect investor sentiment, not just underlying business performance. One imperfect but simple way to consider how the market perception of a company has shifted is to compare the change in the earnings per share (EPS) with the share price movement.
DoubleDown Interactive fell to a loss making position during the year. While this may prove temporary, we'd consider it a negative, so it doesn't surprise us that the stock price is down. However, there may be an opportunity for investors if the company can recover.
The image below shows how EPS has tracked over time (if you click on the image you can see greater detail).
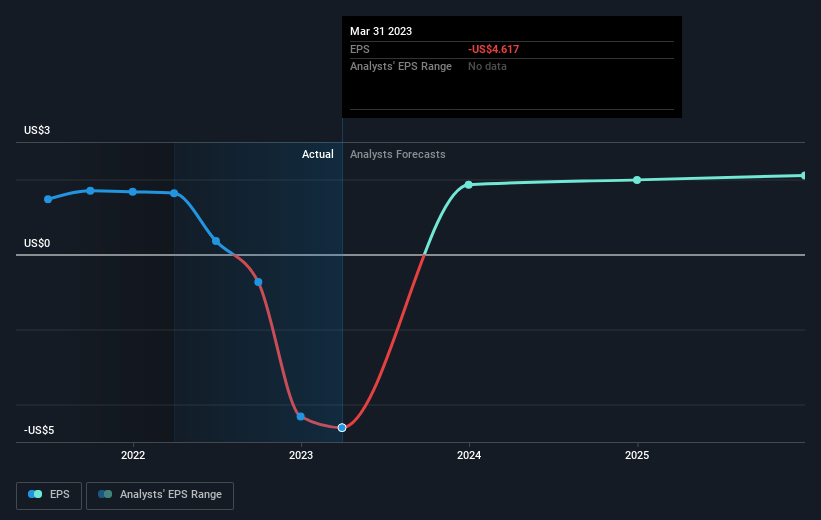
Dive deeper into DoubleDown Interactive's key metrics by checking this interactive graph of DoubleDown Interactive's earnings, revenue and cash flow.
A Different Perspective
While DoubleDown Interactive shareholders are down 15% for the year, the market itself is up 12%. While the aim is to do better than that, it's worth recalling that even great long-term investments sometimes underperform for a year or more. Putting aside the last twelve months, it's good to see the share price has rebounded by 12%, in the last ninety days. Let's just hope this isn't the widely-feared 'dead cat bounce' (which would indicate further declines to come). You could get a better understanding of DoubleDown Interactive's growth by checking out this more detailed historical graph of earnings, revenue and cash flow.
But note: DoubleDown Interactive may not be the best stock to buy. So take a peek at this free list of interesting companies with past earnings growth (and further growth forecast).
Please note, the market returns quoted in this article reflect the market weighted average returns of stocks that currently trade on American exchanges.
Have feedback on this article? Concerned about the content? Get in touch with us directly. Alternatively, email editorial-team (at) simplywallst.com.
This article by Simply Wall St is general in nature. We provide commentary based on historical data and analyst forecasts only using an unbiased methodology and our articles are not intended to be financial advice. It does not constitute a recommendation to buy or sell any stock, and does not take account of your objectives, or your financial situation. We aim to bring you long-term focused analysis driven by fundamental data. Note that our analysis may not factor in the latest price-sensitive company announcements or qualitative material. Simply Wall St has no position in any stocks mentioned.
Join A Paid User Research Session
You’ll receive a US$30 Amazon Gift card for 1 hour of your time while helping us build better investing tools for the individual investors like yourself. Sign up here
