Investors in Finbar Group (ASX:FRI) have unfortunately lost 4.0% over the last five years
For many, the main point of investing is to generate higher returns than the overall market. But every investor is virtually certain to have both over-performing and under-performing stocks. So we wouldn't blame long term Finbar Group Limited (ASX:FRI) shareholders for doubting their decision to hold, with the stock down 22% over a half decade. In contrast, the stock price has popped 8.1% in the last thirty days.
Now let's have a look at the company's fundamentals, and see if the long term shareholder return has matched the performance of the underlying business.
See our latest analysis for Finbar Group
To paraphrase Benjamin Graham: Over the short term the market is a voting machine, but over the long term it's a weighing machine. By comparing earnings per share (EPS) and share price changes over time, we can get a feel for how investor attitudes to a company have morphed over time.
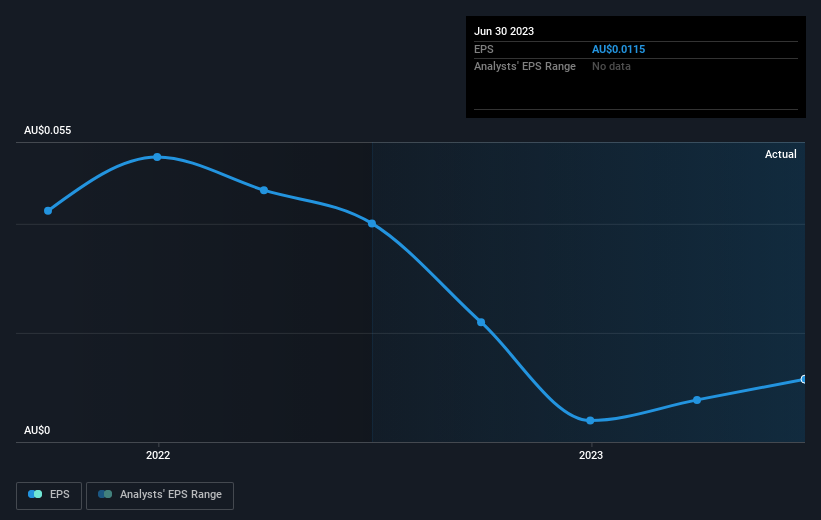
Looking back five years, both Finbar Group's share price and EPS declined; the latter at a rate of 28% per year. The share price decline of 5% per year isn't as bad as the EPS decline. So the market may previously have expected a drop, or else it expects the situation will improve. The high P/E ratio of 58.16 suggests that shareholders believe earnings will grow in the years ahead.
You can see below how EPS has changed over time (discover the exact values by clicking on the image).
We consider it positive that insiders have made significant purchases in the last year. Even so, future earnings will be far more important to whether current shareholders make money. It might be well worthwhile taking a look at our free report on Finbar Group's earnings, revenue and cash flow.
What About The Total Shareholder Return (TSR)?
We've already covered Finbar Group's share price action, but we should also mention its total shareholder return (TSR). The TSR is a return calculation that accounts for the value of cash dividends (assuming that any dividend received was reinvested) and the calculated value of any discounted capital raisings and spin-offs. Dividends have been really beneficial for Finbar Group shareholders, and that cash payout explains why its total shareholder loss of 4.0%, over the last 5 years, isn't as bad as the share price return.
A Different Perspective
Finbar Group shareholders are up 3.1% for the year. But that was short of the market average. But at least that's still a gain! Over five years the TSR has been a reduction of 0.8% per year, over five years. So this might be a sign the business has turned its fortunes around. I find it very interesting to look at share price over the long term as a proxy for business performance. But to truly gain insight, we need to consider other information, too. Case in point: We've spotted 3 warning signs for Finbar Group you should be aware of.
There are plenty of other companies that have insiders buying up shares. You probably do not want to miss this free list of growing companies that insiders are buying.
Please note, the market returns quoted in this article reflect the market weighted average returns of stocks that currently trade on Australian exchanges.
Have feedback on this article? Concerned about the content? Get in touch with us directly. Alternatively, email editorial-team (at) simplywallst.com.
This article by Simply Wall St is general in nature. We provide commentary based on historical data and analyst forecasts only using an unbiased methodology and our articles are not intended to be financial advice. It does not constitute a recommendation to buy or sell any stock, and does not take account of your objectives, or your financial situation. We aim to bring you long-term focused analysis driven by fundamental data. Note that our analysis may not factor in the latest price-sensitive company announcements or qualitative material. Simply Wall St has no position in any stocks mentioned.
