Investors in FinVolution Group (NYSE:FINV) have made a strong return of 251% over the past three years
The most you can lose on any stock (assuming you don't use leverage) is 100% of your money. But if you buy shares in a really great company, you can more than double your money. For instance the FinVolution Group (NYSE:FINV) share price is 207% higher than it was three years ago. That sort of return is as solid as granite. In contrast, the stock has fallen 9.4% in the last 30 days. We note that the broader market is down 3.3% in the last month, and this may have impacted FinVolution Group's share price.
Let's take a look at the underlying fundamentals over the longer term, and see if they've been consistent with shareholders returns.
Check out our latest analysis for FinVolution Group
There is no denying that markets are sometimes efficient, but prices do not always reflect underlying business performance. One imperfect but simple way to consider how the market perception of a company has shifted is to compare the change in the earnings per share (EPS) with the share price movement.
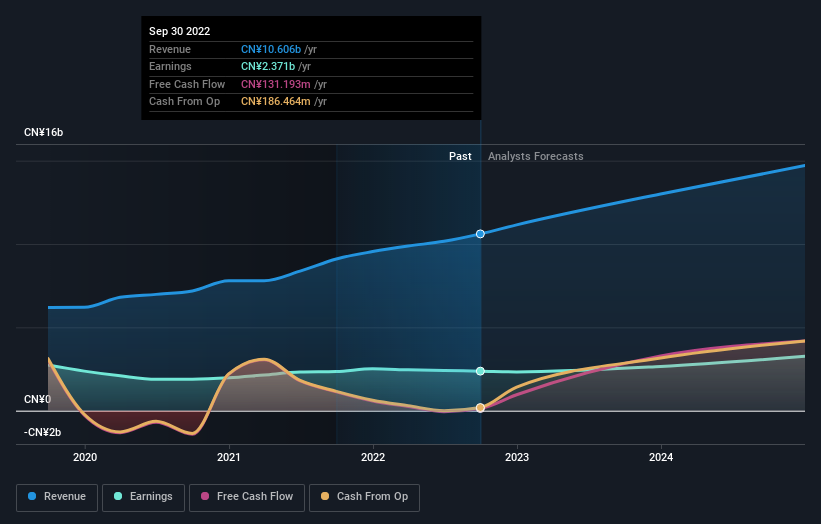
During the three years of share price growth, FinVolution Group actually saw its earnings per share (EPS) drop 2.8% per year.
Companies are not always focussed on EPS growth in the short term, and looking at how the share price has reacted, we don't think EPS is the most important metric for FinVolution Group at the moment. Since the change in EPS doesn't seem to correlate with the change in share price, it's worth taking a look at other metrics.
It could be that the revenue growth of 19% per year is viewed as evidence that FinVolution Group is growing. In that case, the company may be sacrificing current earnings per share to drive growth, and maybe shareholder's faith in better days ahead will be rewarded.
You can see below how earnings and revenue have changed over time (discover the exact values by clicking on the image).
This free interactive report on FinVolution Group's balance sheet strength is a great place to start, if you want to investigate the stock further.
What About Dividends?
It is important to consider the total shareholder return, as well as the share price return, for any given stock. Whereas the share price return only reflects the change in the share price, the TSR includes the value of dividends (assuming they were reinvested) and the benefit of any discounted capital raising or spin-off. It's fair to say that the TSR gives a more complete picture for stocks that pay a dividend. In the case of FinVolution Group, it has a TSR of 251% for the last 3 years. That exceeds its share price return that we previously mentioned. This is largely a result of its dividend payments!
A Different Perspective
It's nice to see that FinVolution Group shareholders have received a total shareholder return of 56% over the last year. Of course, that includes the dividend. That certainly beats the loss of about 4% per year over the last half decade. The long term loss makes us cautious, but the short term TSR gain certainly hints at a brighter future. It's always interesting to track share price performance over the longer term. But to understand FinVolution Group better, we need to consider many other factors. To that end, you should learn about the 2 warning signs we've spotted with FinVolution Group (including 1 which is concerning) .
Of course FinVolution Group may not be the best stock to buy. So you may wish to see this free collection of growth stocks.
Please note, the market returns quoted in this article reflect the market weighted average returns of stocks that currently trade on US exchanges.
Have feedback on this article? Concerned about the content? Get in touch with us directly. Alternatively, email editorial-team (at) simplywallst.com.
This article by Simply Wall St is general in nature. We provide commentary based on historical data and analyst forecasts only using an unbiased methodology and our articles are not intended to be financial advice. It does not constitute a recommendation to buy or sell any stock, and does not take account of your objectives, or your financial situation. We aim to bring you long-term focused analysis driven by fundamental data. Note that our analysis may not factor in the latest price-sensitive company announcements or qualitative material. Simply Wall St has no position in any stocks mentioned.
Join A Paid User Research Session
You’ll receive a US$30 Amazon Gift card for 1 hour of your time while helping us build better investing tools for the individual investors like yourself. Sign up here
