Investors in Gulf Keystone Petroleum (LON:GKP) have unfortunately lost 40% over the last year
Investors can approximate the average market return by buying an index fund. Active investors aim to buy stocks that vastly outperform the market - but in the process, they risk under-performance. For example, the Gulf Keystone Petroleum Limited ( LON:GKP ) share price is down 51% in the last year. That's well below the market return of 7.7%. On the bright side, the stock is actually up 40% in the last three years. Furthermore, it's down 22% in about a quarter. We do note than an ongoing dispute between the Turkish and Iraqi governments has lead to a shutdown of the company's Kurdish production lines, which is weighing heavy on the share price.
With that in mind, it's worth seeing if the company's underlying fundamentals have been the driver of long term performance, or if there are some discrepancies.
View our latest analysis for Gulf Keystone Petroleum
While the efficient markets hypothesis continues to be taught by some, it has been proven that markets are over-reactive dynamic systems, and investors are not always rational. One flawed but reasonable way to assess how sentiment around a company has changed is to compare the earnings per share (EPS) with the share price.
Even though the Gulf Keystone Petroleum share price is down over the year, its EPS actually improved. It could be that the market is giving too much weight to these Kurdish production cuts.
It's fair to say that the share price does not seem to be reflecting the EPS growth. So it's easy to justify a look at some other metrics.
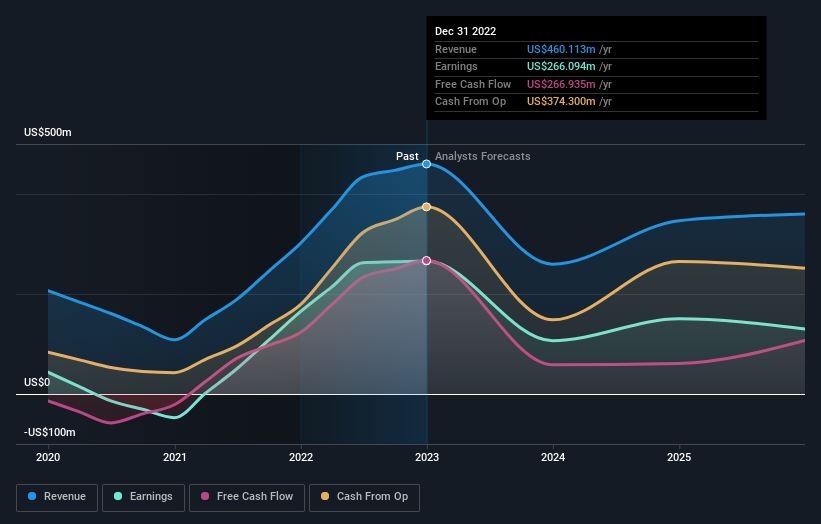
We don't see any weakness in the Gulf Keystone Petroleum's dividend so the steady payout can't really explain the share price drop. From what we can see, revenue is pretty flat, so that doesn't really explain the share price drop. Unless, of course, the market was expecting a revenue uptick.
The company's revenue and earnings (over time) are depicted in the image below (click to see the exact numbers).
It is of course excellent to see how Gulf Keystone Petroleum has grown profits over the years, but the future is more important for shareholders. Take a more thorough look at Gulf Keystone Petroleum's financial health with this free report on its balance sheet .
What About Dividends?
As well as measuring the share price return, investors should also consider the total shareholder return (TSR). Whereas the share price return only reflects the change in the share price, the TSR includes the value of dividends (assuming they were reinvested) and the benefit of any discounted capital raising or spin-off. So for companies that pay a generous dividend, the TSR is often a lot higher than the share price return. We note that for Gulf Keystone Petroleum the TSR over the last 1 year was -40%, which is better than the share price return mentioned above. This is largely a result of its dividend payments!
A Different Perspective
Investors in Gulf Keystone Petroleum had a tough year, with a total loss of 40% (including dividends), against a market gain of about 7.7%. Even the share prices of good stocks drop sometimes, but we want to see improvements in the fundamental metrics of a business, before getting too interested. On the bright side, long term shareholders have made money, with a gain of 4% per year over half a decade. If the fundamental data continues to indicate long term sustainable growth, the current sell-off could be an opportunity worth considering. It's always interesting to track share price performance over the longer term. But to understand Gulf Keystone Petroleum better, we need to consider many other factors. Case in point: We've spotted 3 warning signs for Gulf Keystone Petroleum you should be aware of, and 1 of them is a bit concerning.
But note: Gulf Keystone Petroleum may not be the best stock to buy . So take a peek at this free list of interesting companies with past earnings growth (and further growth forecast).
Please note, the market returns quoted in this article reflect the market weighted average returns of stocks that currently trade on British exchanges.
Have feedback on this article? Concerned about the content? Get in touch with us directly. Alternatively, email editorial-team (at) simplywallst.com.
This article by Simply Wall St is general in nature. We provide commentary based on historical data and analyst forecasts only using an unbiased methodology and our articles are not intended to be financial advice. It does not constitute a recommendation to buy or sell any stock, and does not take account of your objectives, or your financial situation. We aim to bring you long-term focused analysis driven by fundamental data. Note that our analysis may not factor in the latest price-sensitive company announcements or qualitative material. Simply Wall St has no position in any stocks mentioned.
Join A Paid User Research Session
You’ll receive a US$30 Amazon Gift card for 1 hour of your time while helping us build better investing tools for the individual investors like yourself. Sign up here
