Investors might be losing patience for BRP Group's (NASDAQ:BRP) increasing losses, as stock sheds 3.4% over the past week
By buying an index fund, investors can approximate the average market return. But if you choose individual stocks with prowess, you can make superior returns. Just take a look at BRP Group, Inc. (NASDAQ:BRP), which is up 65%, over three years, soundly beating the market return of 25% (not including dividends).
While the stock has fallen 3.4% this week, it's worth focusing on the longer term and seeing if the stocks historical returns have been driven by the underlying fundamentals.
View our latest analysis for BRP Group
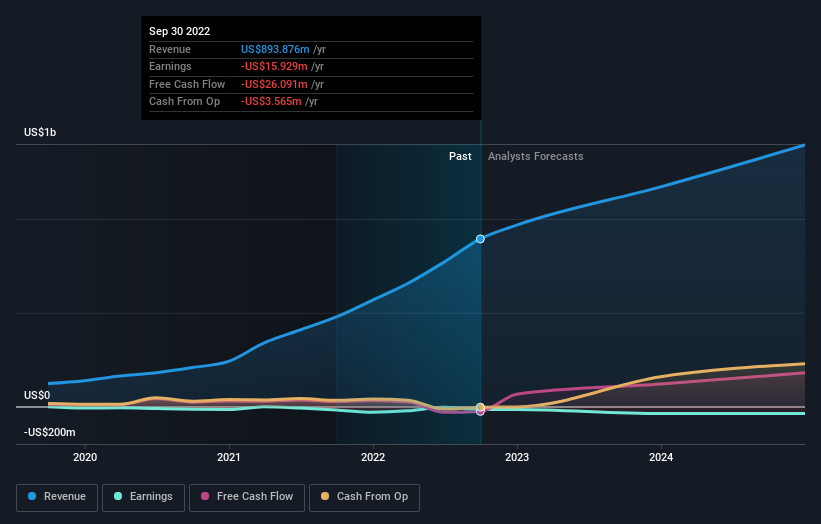
BRP Group wasn't profitable in the last twelve months, it is unlikely we'll see a strong correlation between its share price and its earnings per share (EPS). Arguably revenue is our next best option. When a company doesn't make profits, we'd generally expect to see good revenue growth. That's because fast revenue growth can be easily extrapolated to forecast profits, often of considerable size.
In the last 3 years BRP Group saw its revenue grow at 64% per year. That's much better than most loss-making companies. While the compound gain of 18% per year over three years is pretty good, you might argue it doesn't fully reflect the strong revenue growth. If that's the case, now might be the time to take a close look at BRP Group. A window of opportunity may reveal itself with time, if the business can trend to profitability.
You can see how earnings and revenue have changed over time in the image below (click on the chart to see the exact values).
It's good to see that there was some significant insider buying in the last three months. That's a positive. That said, we think earnings and revenue growth trends are even more important factors to consider. You can see what analysts are predicting for BRP Group in this interactive graph of future profit estimates.
A Different Perspective
BRP Group shareholders are down 28% for the year, falling short of the market return. The market shed around 21%, no doubt weighing on the stock price. Fortunately the longer term story is brighter, with total returns averaging about 18% per year over three years. The recent sell-off could be an opportunity if the business remains sound, so it may be worth checking the fundamental data for signs of a long-term growth trend. I find it very interesting to look at share price over the long term as a proxy for business performance. But to truly gain insight, we need to consider other information, too. Case in point: We've spotted 4 warning signs for BRP Group you should be aware of, and 1 of them is significant.
If you like to buy stocks alongside management, then you might just love this free list of companies. (Hint: insiders have been buying them).
Please note, the market returns quoted in this article reflect the market weighted average returns of stocks that currently trade on US exchanges.
Have feedback on this article? Concerned about the content? Get in touch with us directly. Alternatively, email editorial-team (at) simplywallst.com.
This article by Simply Wall St is general in nature. We provide commentary based on historical data and analyst forecasts only using an unbiased methodology and our articles are not intended to be financial advice. It does not constitute a recommendation to buy or sell any stock, and does not take account of your objectives, or your financial situation. We aim to bring you long-term focused analysis driven by fundamental data. Note that our analysis may not factor in the latest price-sensitive company announcements or qualitative material. Simply Wall St has no position in any stocks mentioned.
Join A Paid User Research Session
You’ll receive a US$30 Amazon Gift card for 1 hour of your time while helping us build better investing tools for the individual investors like yourself. Sign up here
