Investors in Northeast Community Bancorp (NASDAQ:NECB) have seen solid returns of 139% over the past three years
Northeast Community Bancorp, Inc. (NASDAQ:NECB) shareholders might be concerned after seeing the share price drop 19% in the last quarter. In contrast, the return over three years has been impressive. In fact, the share price is up a full 124% compared to three years ago. So the recent fall in the share price should be viewed in that context. The fundamental business performance will ultimately dictate whether the top is in, or if this is a stellar buying opportunity.
So let's investigate and see if the longer term performance of the company has been in line with the underlying business' progress.
See our latest analysis for Northeast Community Bancorp
In his essay The Superinvestors of Graham-and-Doddsville Warren Buffett described how share prices do not always rationally reflect the value of a business. By comparing earnings per share (EPS) and share price changes over time, we can get a feel for how investor attitudes to a company have morphed over time.
During three years of share price growth, Northeast Community Bancorp achieved compound earnings per share growth of 43% per year. The average annual share price increase of 31% is actually lower than the EPS growth. Therefore, it seems the market has moderated its expectations for growth, somewhat. We'd venture the lowish P/E ratio of 5.55 also reflects the negative sentiment around the stock.
The image below shows how EPS has tracked over time (if you click on the image you can see greater detail).
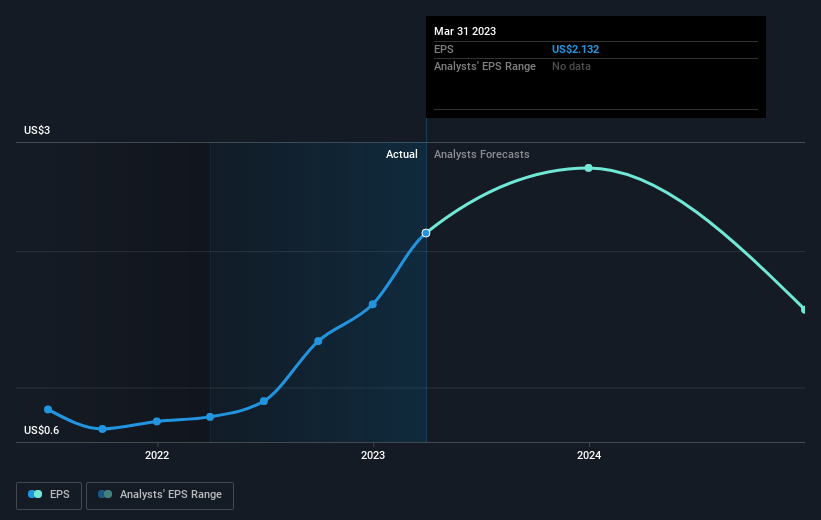
We consider it positive that insiders have made significant purchases in the last year. Having said that, most people consider earnings and revenue growth trends to be a more meaningful guide to the business. Before buying or selling a stock, we always recommend a close examination of historic growth trends, available here..
What About Dividends?
When looking at investment returns, it is important to consider the difference between total shareholder return (TSR) and share price return. Whereas the share price return only reflects the change in the share price, the TSR includes the value of dividends (assuming they were reinvested) and the benefit of any discounted capital raising or spin-off. It's fair to say that the TSR gives a more complete picture for stocks that pay a dividend. We note that for Northeast Community Bancorp the TSR over the last 3 years was 139%, which is better than the share price return mentioned above. And there's no prize for guessing that the dividend payments largely explain the divergence!
A Different Perspective
We're pleased to report that Northeast Community Bancorp shareholders have received a total shareholder return of 22% over one year. That's including the dividend. That gain is better than the annual TSR over five years, which is 11%. Therefore it seems like sentiment around the company has been positive lately. Someone with an optimistic perspective could view the recent improvement in TSR as indicating that the business itself is getting better with time. It's always interesting to track share price performance over the longer term. But to understand Northeast Community Bancorp better, we need to consider many other factors. Like risks, for instance. Every company has them, and we've spotted 2 warning signs for Northeast Community Bancorp (of which 1 is a bit concerning!) you should know about.
Northeast Community Bancorp is not the only stock that insiders are buying. For those who like to find winning investments this free list of growing companies with recent insider purchasing, could be just the ticket.
Please note, the market returns quoted in this article reflect the market weighted average returns of stocks that currently trade on American exchanges.
Have feedback on this article? Concerned about the content? Get in touch with us directly. Alternatively, email editorial-team (at) simplywallst.com.
This article by Simply Wall St is general in nature. We provide commentary based on historical data and analyst forecasts only using an unbiased methodology and our articles are not intended to be financial advice. It does not constitute a recommendation to buy or sell any stock, and does not take account of your objectives, or your financial situation. We aim to bring you long-term focused analysis driven by fundamental data. Note that our analysis may not factor in the latest price-sensitive company announcements or qualitative material. Simply Wall St has no position in any stocks mentioned.
Join A Paid User Research Session
You’ll receive a US$30 Amazon Gift card for 1 hour of your time while helping us build better investing tools for the individual investors like yourself. Sign up here
