Investors one-year losses grow to 19% as the stock sheds AU$1.9m this past week
The simplest way to benefit from a rising market is to buy an index fund. When you buy individual stocks, you can make higher profits, but you also face the risk of under-performance. For example, the 3D Resources Limited (ASX:DDD) share price is down 30% in the last year. That's well below the market return of 17%. The silver lining (for longer term investors) is that the stock is still 17% higher than it was three years ago.
With the stock having lost 13% in the past week, it's worth taking a look at business performance and seeing if there's any red flags.
View our latest analysis for 3D Resources
With just AU$170,679 worth of revenue in twelve months, we don't think the market considers 3D Resources to have proven its business plan. We can't help wondering why it's publicly listed so early in its journey. Are venture capitalists not interested? As a result, we think it's unlikely shareholders are paying much attention to current revenue, but rather speculating on growth in the years to come. It seems likely some shareholders believe that 3D Resources will find or develop a valuable new mine before too long.
We think companies that have neither significant revenues nor profits are pretty high risk. There is usually a significant chance that they will need more money for business development, putting them at the mercy of capital markets to raise equity. So the share price itself impacts the value of the shares (as it determines the cost of capital). While some such companies go on to make revenue, profits, and generate value, others get hyped up by hopeful naifs before eventually going bankrupt.
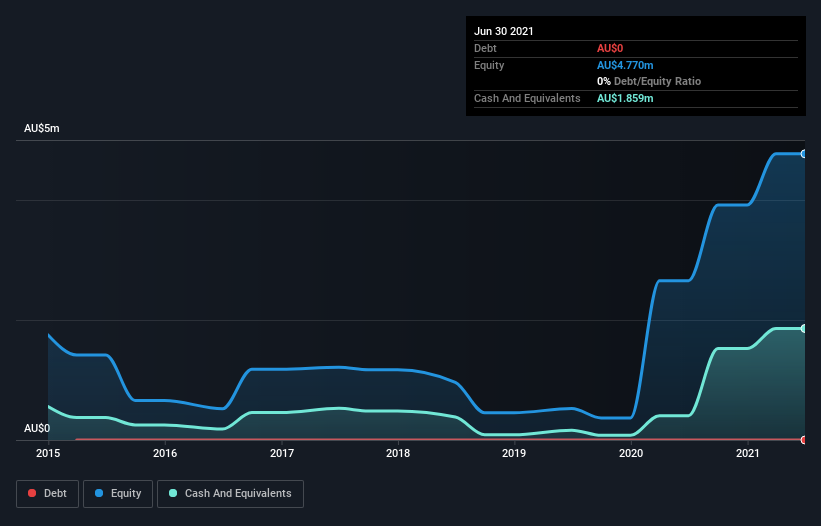
When it reported in June 2021 3D Resources had minimal cash in excess of all liabilities consider its expenditure: just AU$1.5m to be specific. So if it has not already moved to replenish reserves, we think the near-term chances of a capital raising event are pretty high. That probably explains why the share price is down 30% in the last year. You can click on the image below to see (in greater detail) how 3D Resources' cash levels have changed over time.
It can be extremely risky to invest in a company that doesn't even have revenue. There's no way to know its value easily. What if insiders are ditching the stock hand over fist? I would feel more nervous about the company if that were so. It only takes a moment for you to check whether we have identified any insider sales recently.
What about the Total Shareholder Return (TSR)?
Investors should note that there's a difference between 3D Resources' total shareholder return (TSR) and its share price change, which we've covered above. Arguably the TSR is a more complete return calculation because it accounts for the value of dividends (as if they were reinvested), along with the hypothetical value of any discounted capital that have been offered to shareholders. 3D Resources hasn't been paying dividends, but its TSR of -19% exceeds its share price return of -30%, implying it has either spun-off a business, or raised capital at a discount; thereby providing additional value to shareholders.
A Different Perspective
While the broader market gained around 17% in the last year, 3D Resources shareholders lost 19%. Even the share prices of good stocks drop sometimes, but we want to see improvements in the fundamental metrics of a business, before getting too interested. Longer term investors wouldn't be so upset, since they would have made 3%, each year, over five years. If the fundamental data continues to indicate long term sustainable growth, the current sell-off could be an opportunity worth considering. It's always interesting to track share price performance over the longer term. But to understand 3D Resources better, we need to consider many other factors. Case in point: We've spotted 6 warning signs for 3D Resources you should be aware of, and 4 of them are a bit concerning.
Of course 3D Resources may not be the best stock to buy. So you may wish to see this free collection of growth stocks.
Please note, the market returns quoted in this article reflect the market weighted average returns of stocks that currently trade on AU exchanges.
Have feedback on this article? Concerned about the content? Get in touch with us directly. Alternatively, email editorial-team (at) simplywallst.com.
This article by Simply Wall St is general in nature. We provide commentary based on historical data and analyst forecasts only using an unbiased methodology and our articles are not intended to be financial advice. It does not constitute a recommendation to buy or sell any stock, and does not take account of your objectives, or your financial situation. We aim to bring you long-term focused analysis driven by fundamental data. Note that our analysis may not factor in the latest price-sensitive company announcements or qualitative material. Simply Wall St has no position in any stocks mentioned.
