Investors in Parke Bancorp (NASDAQ:PKBK) have unfortunately lost 13% over the last three years
In order to justify the effort of selecting individual stocks, it's worth striving to beat the returns from a market index fund. But in any portfolio, there are likely to be some stocks that fall short of that benchmark. Unfortunately, that's been the case for longer term Parke Bancorp, Inc. (NASDAQ:PKBK) shareholders, since the share price is down 21% in the last three years, falling well short of the market return of around 22%. Furthermore, it's down 17% in about a quarter. That's not much fun for holders. We note that the company has reported results fairly recently; and the market is hardly delighted. You can check out the latest numbers in our company report.
With that in mind, it's worth seeing if the company's underlying fundamentals have been the driver of long term performance, or if there are some discrepancies.
View our latest analysis for Parke Bancorp
There is no denying that markets are sometimes efficient, but prices do not always reflect underlying business performance. One flawed but reasonable way to assess how sentiment around a company has changed is to compare the earnings per share (EPS) with the share price.
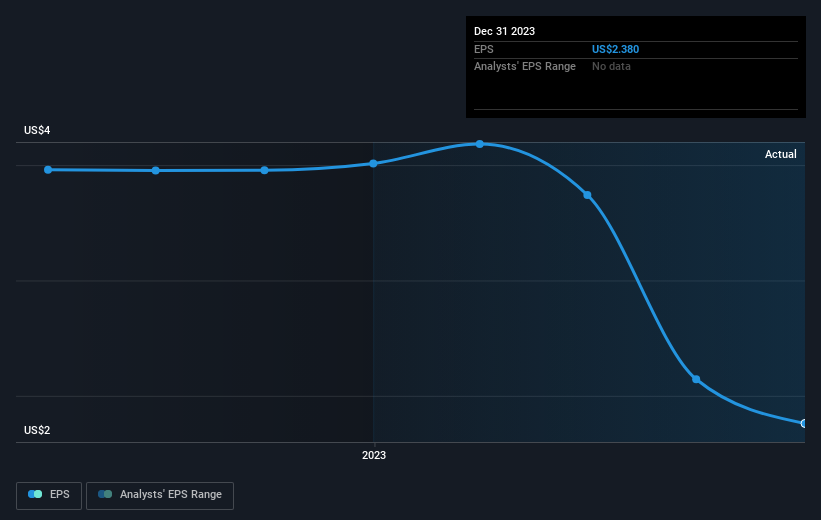
Parke Bancorp saw its EPS decline at a compound rate of 0.3% per year, over the last three years. This reduction in EPS is slower than the 8% annual reduction in the share price. So it's likely that the EPS decline has disappointed the market, leaving investors hesitant to buy. This increased caution is also evident in the rather low P/E ratio, which is sitting at 6.94.
The image below shows how EPS has tracked over time (if you click on the image you can see greater detail).
We like that insiders have been buying shares in the last twelve months. Having said that, most people consider earnings and revenue growth trends to be a more meaningful guide to the business. This free interactive report on Parke Bancorp's earnings, revenue and cash flow is a great place to start, if you want to investigate the stock further.
What About Dividends?
When looking at investment returns, it is important to consider the difference between total shareholder return (TSR) and share price return. The TSR is a return calculation that accounts for the value of cash dividends (assuming that any dividend received was reinvested) and the calculated value of any discounted capital raisings and spin-offs. Arguably, the TSR gives a more comprehensive picture of the return generated by a stock. In the case of Parke Bancorp, it has a TSR of -13% for the last 3 years. That exceeds its share price return that we previously mentioned. This is largely a result of its dividend payments!
A Different Perspective
While the broader market gained around 31% in the last year, Parke Bancorp shareholders lost 3.3% (even including dividends). However, keep in mind that even the best stocks will sometimes underperform the market over a twelve month period. On the bright side, long term shareholders have made money, with a gain of 1.5% per year over half a decade. If the fundamental data continues to indicate long term sustainable growth, the current sell-off could be an opportunity worth considering. I find it very interesting to look at share price over the long term as a proxy for business performance. But to truly gain insight, we need to consider other information, too. For instance, we've identified 1 warning sign for Parke Bancorp that you should be aware of.
Parke Bancorp is not the only stock insiders are buying. So take a peek at this free list of growing companies with insider buying.
Please note, the market returns quoted in this article reflect the market weighted average returns of stocks that currently trade on American exchanges.
Have feedback on this article? Concerned about the content? Get in touch with us directly. Alternatively, email editorial-team (at) simplywallst.com.
This article by Simply Wall St is general in nature. We provide commentary based on historical data and analyst forecasts only using an unbiased methodology and our articles are not intended to be financial advice. It does not constitute a recommendation to buy or sell any stock, and does not take account of your objectives, or your financial situation. We aim to bring you long-term focused analysis driven by fundamental data. Note that our analysis may not factor in the latest price-sensitive company announcements or qualitative material. Simply Wall St has no position in any stocks mentioned.
