Investors in Saratoga Investment (NYSE:SAR) have seen strong returns of 101% over the past three years
By buying an index fund, investors can approximate the average market return. But if you choose individual stocks with prowess, you can make superior returns. For example, the Saratoga Investment Corp. (NYSE:SAR) share price is up 53% in the last three years, clearly besting the market return of around 33% (not including dividends). On the other hand, the returns haven't been quite so good recently, with shareholders up just 24% , including dividends .
Now it's worth having a look at the company's fundamentals too, because that will help us determine if the long term shareholder return has matched the performance of the underlying business.
Check out our latest analysis for Saratoga Investment
There is no denying that markets are sometimes efficient, but prices do not always reflect underlying business performance. By comparing earnings per share (EPS) and share price changes over time, we can get a feel for how investor attitudes to a company have morphed over time.
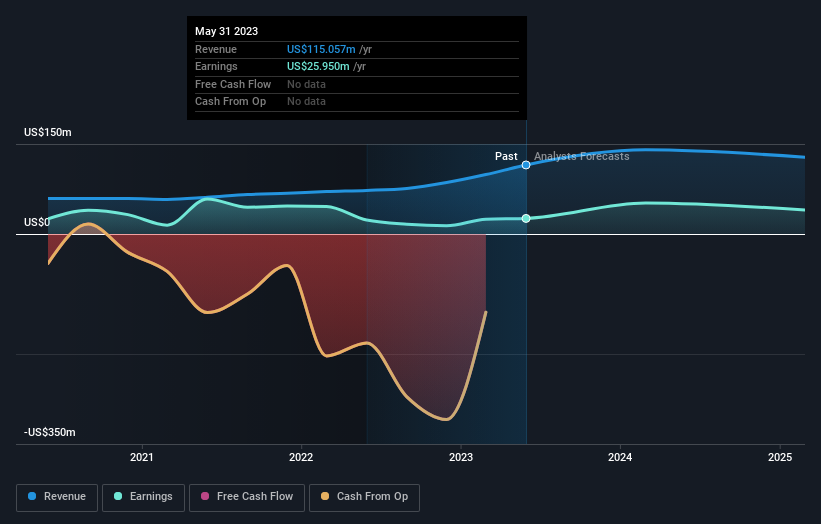
During the three years of share price growth, Saratoga Investment actually saw its earnings per share (EPS) drop 4.3% per year.
Given the share price resilience, we don't think the (declining) EPS numbers are a good measure of how the business is moving forward, right now. Since the change in EPS doesn't seem to correlate with the change in share price, it's worth taking a look at other metrics.
Interestingly, the dividend has increased over time; so that may have given the share price a boost. Sometimes yield-chasing investors will flock to a company if they think the dividend can grow over time. The revenue growth of about 22% per year might also encourage buyers.
You can see how earnings and revenue have changed over time in the image below (click on the chart to see the exact values).
This free interactive report on Saratoga Investment's balance sheet strength is a great place to start, if you want to investigate the stock further.
What About Dividends?
When looking at investment returns, it is important to consider the difference between total shareholder return (TSR) and share price return. Whereas the share price return only reflects the change in the share price, the TSR includes the value of dividends (assuming they were reinvested) and the benefit of any discounted capital raising or spin-off. It's fair to say that the TSR gives a more complete picture for stocks that pay a dividend. We note that for Saratoga Investment the TSR over the last 3 years was 101%, which is better than the share price return mentioned above. This is largely a result of its dividend payments!
A Different Perspective
It's nice to see that Saratoga Investment shareholders have received a total shareholder return of 24% over the last year. Of course, that includes the dividend. Since the one-year TSR is better than the five-year TSR (the latter coming in at 10% per year), it would seem that the stock's performance has improved in recent times. Someone with an optimistic perspective could view the recent improvement in TSR as indicating that the business itself is getting better with time. While it is well worth considering the different impacts that market conditions can have on the share price, there are other factors that are even more important. Even so, be aware that Saratoga Investment is showing 3 warning signs in our investment analysis , and 2 of those are concerning...
For those who like to find winning investments this free list of growing companies with recent insider purchasing, could be just the ticket.
Please note, the market returns quoted in this article reflect the market weighted average returns of stocks that currently trade on American exchanges.
Have feedback on this article? Concerned about the content? Get in touch with us directly. Alternatively, email editorial-team (at) simplywallst.com.
This article by Simply Wall St is general in nature. We provide commentary based on historical data and analyst forecasts only using an unbiased methodology and our articles are not intended to be financial advice. It does not constitute a recommendation to buy or sell any stock, and does not take account of your objectives, or your financial situation. We aim to bring you long-term focused analysis driven by fundamental data. Note that our analysis may not factor in the latest price-sensitive company announcements or qualitative material. Simply Wall St has no position in any stocks mentioned.
Join A Paid User Research Session
You’ll receive a US$30 Amazon Gift card for 1 hour of your time while helping us build better investing tools for the individual investors like yourself. Sign up here
