Investors Still Waiting For A Pull Back In Chart Industries, Inc. (NYSE:GTLS)
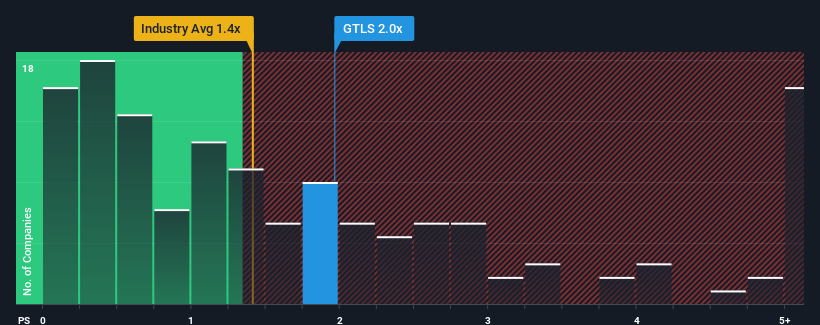
When close to half the companies in the Machinery industry in the United States have price-to-sales ratios (or "P/S") below 1.4x, you may consider Chart Industries, Inc. (NYSE:GTLS) as a stock to potentially avoid with its 2x P/S ratio. Although, it's not wise to just take the P/S at face value as there may be an explanation why it's as high as it is.
Check out our latest analysis for Chart Industries
What Does Chart Industries' P/S Mean For Shareholders?
With revenue growth that's superior to most other companies of late, Chart Industries has been doing relatively well. It seems the market expects this form will continue into the future, hence the elevated P/S ratio. However, if this isn't the case, investors might get caught out paying too much for the stock.
If you'd like to see what analysts are forecasting going forward, you should check out our free report on Chart Industries.
What Are Revenue Growth Metrics Telling Us About The High P/S?
The only time you'd be truly comfortable seeing a P/S as high as Chart Industries' is when the company's growth is on track to outshine the industry.
If we review the last year of revenue growth, the company posted a terrific increase of 79%. The strong recent performance means it was also able to grow revenue by 134% in total over the last three years. Therefore, it's fair to say the revenue growth recently has been superb for the company.
Looking ahead now, revenue is anticipated to climb by 27% per year during the coming three years according to the analysts following the company. With the industry only predicted to deliver 7.6% per year, the company is positioned for a stronger revenue result.
In light of this, it's understandable that Chart Industries' P/S sits above the majority of other companies. It seems most investors are expecting this strong future growth and are willing to pay more for the stock.
The Bottom Line On Chart Industries' P/S
Typically, we'd caution against reading too much into price-to-sales ratios when settling on investment decisions, though it can reveal plenty about what other market participants think about the company.
We've established that Chart Industries maintains its high P/S on the strength of its forecasted revenue growth being higher than the the rest of the Machinery industry, as expected. Right now shareholders are comfortable with the P/S as they are quite confident future revenues aren't under threat. Unless the analysts have really missed the mark, these strong revenue forecasts should keep the share price buoyant.
Before you take the next step, you should know about the 1 warning sign for Chart Industries that we have uncovered.
If you're unsure about the strength of Chart Industries' business, why not explore our interactive list of stocks with solid business fundamentals for some other companies you may have missed.
Have feedback on this article? Concerned about the content? Get in touch with us directly. Alternatively, email editorial-team (at) simplywallst.com.
This article by Simply Wall St is general in nature. We provide commentary based on historical data and analyst forecasts only using an unbiased methodology and our articles are not intended to be financial advice. It does not constitute a recommendation to buy or sell any stock, and does not take account of your objectives, or your financial situation. We aim to bring you long-term focused analysis driven by fundamental data. Note that our analysis may not factor in the latest price-sensitive company announcements or qualitative material. Simply Wall St has no position in any stocks mentioned.
