Investors in TFI International (TSE:TFII) have seen enviable returns of 471% over the past five years
We think all investors should try to buy and hold high quality multi-year winners. While the best companies are hard to find, but they can generate massive returns over long periods. Don't believe it? Then look at the TFI International Inc. (TSE:TFII) share price. It's 426% higher than it was five years ago. If that doesn't get you thinking about long term investing, we don't know what will. Also pleasing for shareholders was the 26% gain in the last three months.
So let's assess the underlying fundamentals over the last 5 years and see if they've moved in lock-step with shareholder returns.
View our latest analysis for TFI International
In his essay The Superinvestors of Graham-and-Doddsville Warren Buffett described how share prices do not always rationally reflect the value of a business. By comparing earnings per share (EPS) and share price changes over time, we can get a feel for how investor attitudes to a company have morphed over time.
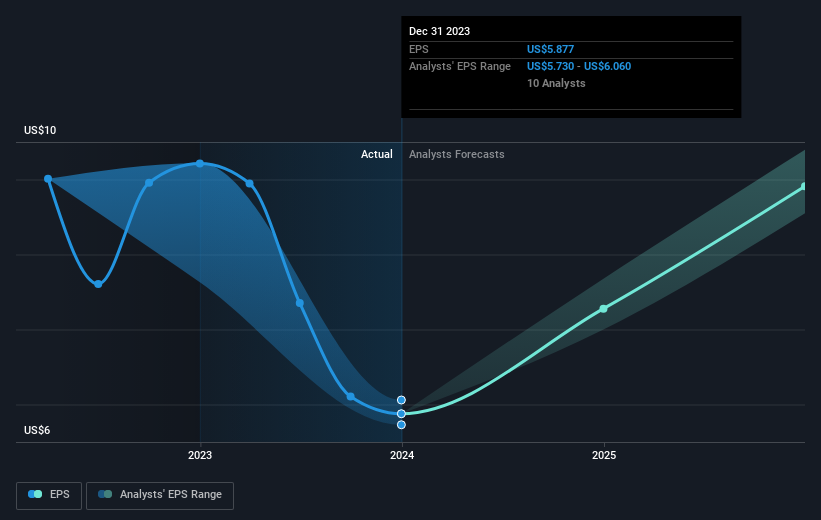
During five years of share price growth, TFI International achieved compound earnings per share (EPS) growth of 20% per year. This EPS growth is slower than the share price growth of 39% per year, over the same period. So it's fair to assume the market has a higher opinion of the business than it did five years ago. That's not necessarily surprising considering the five-year track record of earnings growth.
The graphic below depicts how EPS has changed over time (unveil the exact values by clicking on the image).
It's good to see that there was some significant insider buying in the last three months. That's a positive. That said, we think earnings and revenue growth trends are even more important factors to consider. Dive deeper into the earnings by checking this interactive graph of TFI International's earnings, revenue and cash flow.
What About Dividends?
It is important to consider the total shareholder return, as well as the share price return, for any given stock. The TSR is a return calculation that accounts for the value of cash dividends (assuming that any dividend received was reinvested) and the calculated value of any discounted capital raisings and spin-offs. So for companies that pay a generous dividend, the TSR is often a lot higher than the share price return. In the case of TFI International, it has a TSR of 471% for the last 5 years. That exceeds its share price return that we previously mentioned. This is largely a result of its dividend payments!
A Different Perspective
It's good to see that TFI International has rewarded shareholders with a total shareholder return of 28% in the last twelve months. Of course, that includes the dividend. Having said that, the five-year TSR of 42% a year, is even better. Potential buyers might understandably feel they've missed the opportunity, but it's always possible business is still firing on all cylinders. I find it very interesting to look at share price over the long term as a proxy for business performance. But to truly gain insight, we need to consider other information, too. For example, we've discovered 2 warning signs for TFI International that you should be aware of before investing here.
If you like to buy stocks alongside management, then you might just love this free list of companies. (Hint: insiders have been buying them).
Please note, the market returns quoted in this article reflect the market weighted average returns of stocks that currently trade on Canadian exchanges.
Have feedback on this article? Concerned about the content? Get in touch with us directly. Alternatively, email editorial-team (at) simplywallst.com.
This article by Simply Wall St is general in nature. We provide commentary based on historical data and analyst forecasts only using an unbiased methodology and our articles are not intended to be financial advice. It does not constitute a recommendation to buy or sell any stock, and does not take account of your objectives, or your financial situation. We aim to bring you long-term focused analysis driven by fundamental data. Note that our analysis may not factor in the latest price-sensitive company announcements or qualitative material. Simply Wall St has no position in any stocks mentioned.
